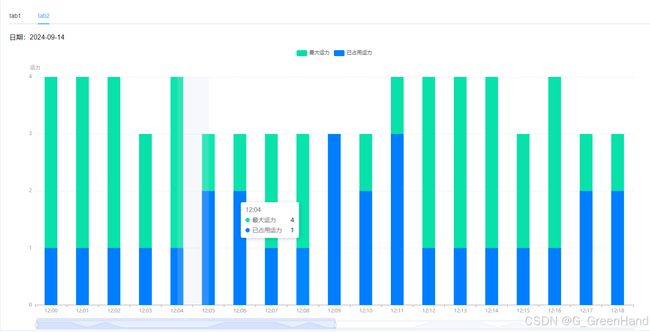
echarts vue柱状图重叠堆积显示图表
html 引用写好的模块
 <div style="width:100%;height:78vh;">
      <StackingBar :data-x="dataX" :data-y="dataY" unit-type="integer" unit-y="" stype-h="78" chart-id="bar1">
      </StackingBar>
 </div>
 <script>
   import StackingBar from '@/components/Echarts/StackingBar.vue';
  export default {
    name: "monitor",
    components: { StackingBar },
    data() {
      return {
       dataX: [],
       dataY: [],
     }
  }
  </script>
StackingBar.vue
<template>
  <div class="histogram">
    <div :id="chartId" :style="myChartStyle" class="categorymin"></div>
  </div>
</template>

<script>
  import * as echarts from 'echarts';
  let moment = require("moment") // 引入
  export default {
    name: "StackingBar",
    props: {
      // 数据
      // dataList: {
      //   type: Array,
      //   default: () => []
      // },

      // 高
      stypeH: {
        type: String,
        default: 400
      },
      chartId: {
        type: String,
        default: ''
      },
 },

    data() {
      return {
        myChartStyle: { float: 'left', width: '100%', height: this.stypeH + 'vh' }, // 图表样式
        dataList:[
          {time:'12:00',total:4,value:1},{time:'12:01',total:4,value:1},{time:'12:02',total:4,value:1},{time:'12:03',total:3,value:1},
        {time:'12:04',total:4,value:1},{time:'12:05',total:3,value:2},{time:'12:06',total:3,value:2},{time:'12:07',total:3,value:1},
        {time:'12:08',total:3,value:1},{time:'12:09',total:3,value:3},{time:'12:10',total:3,value:2},{time:'12:11',total:4,value:3},

        {time:'12:12',total:4,value:1},{time:'12:13',total:4,value:1},{time:'12:14',total:4,value:1},{time:'12:15',total:3,value:1},
        {time:'12:16',total:4,value:1},{time:'12:17',total:3,value:2},{time:'12:18',total:3,value:2},{time:'12:19',total:3,value:1},
        {time:'12:20',total:3,value:1},{time:'12:21',total:3,value:3},{time:'12:22',total:3,value:2},{time:'12:23',total:4,value:3},
        {time:'12:24',total:4,value:1},{time:'12:25',total:4,value:1},{time:'12:26',total:4,value:1},{time:'12:27',total:3,value:1},
        {time:'12:28',total:4,value:1},{time:'12:29',total:3,value:2},{time:'12:30',total:3,value:2},{time:'12:31',total:3,value:1},
        {time:'12:32',total:3,value:1},{time:'12:33',total:3,value:3},{time:'12:34',total:3,value:2},{time:'12:35',total:4,value:3}],
        dataX:[],
        dataY1:[],
        dataY2:[],
        // dataX: ['12:00','12:01','12:02','12:03','12:04','12:05','12:06','12:04','12:08','12:09','12:10'],
        // dataY1: [4,4,4,3,3,3,3,3,3,3],
        // dataY2: [1,1,1,2,2,2,2,3,3,3],
      };
    },
    created() {

    },
    mounted() {
      this.getDate()
    },
    methods: {
      getDate(){
        var that=this
        that.dataX=[];
        that.dataY1=[];
        that.dataY2=[];
        that.dataList.forEach(function (item, index) {
          that.dataX.push(item.time);
          that.dataY1.push(item.total);
          that.dataY2.push(item.value);
        })
        console.log('dataList',that.dataList)
        this.getOption()
      },
      getOption() {
        var option = {
          tooltip: {
            trigger: 'axis',
            axisPointer: {
              type: 'shadow'
            }
          },
          legend: {},
          grid: {
            left: '3%',
            right: '4%',
            bottom: '8%',
            top: "10%",
            containLabel: true,
          },
          xAxis: [
            {
              type: 'category',
              axisLine: {
                lineStyle: {
                  color: '#9A9A9A'
                }
              },
              data: this.dataX
            }
          ],
          yAxis: [
            {
              type: 'value',
              name: '运力',
              axisLine: {
                lineStyle: {
                  color: '#9A9A9A'
                }
              },
              splitLine: {
                lineStyle: {
                  type: 'dashed'//虚线
                },
                show: true //隐藏
              }

            },

          ],
          series: [
          {
              name: '最大运力',
              barWidth: 30,
              type: 'bar',
              z:"1",
              // stack: 'total',
              color: '#00E0A6 ',
              emphasis: {
                focus: 'series'
              },
              data: this.dataY1
            },
            {
              name: '已占用运力',
              barWidth: 30,
              type: 'bar',
              z:"2",
              barGap: '-100%',//柱状重叠
              color: '#007EFF',
              emphasis: {
                focus: 'series'
              },
              data: this.dataY2
            },


          ],
          dataZoom: [
            {
              type: "slider",
              show: true,
              xAxisIndex: [0],
              start: 0,
              end: 50,
              height: 20, //滚动条高度
              backgroundColor: '#fff',
              // fillerColor: '#1890ff',
              textstyle: {
                color: "#ccd7d7"
              },
              filterMode: 'empty',
              // bottom:-10 //距离底部的距离
            }
          ],
        };
        const myChart_a = echarts.init(document.getElementById(this.chartId));
        myChart_a.setOption(option);
        // 随着屏幕大小调节图表
        window.addEventListener("resize", () => {
          myChart_a.resize();
        });
      },
      }
  };
</script>
<style>

</style>