Spring boot项目服务监控-docker-Prometheus-Grafana-AlertManager-webhook-钉钉
目录
-
- 一 Docker Prometheus Grafana 监控 Spring boot项目
-
- 1.1 Springboot 集成 micrometer
- 1.2 deploy prometheus
- 1.3 deploy grafana
- 二 Docker Prometheus AlertManager webhook 报警
-
- 2.1 配置钉钉机器人
- 2.2 deploy alertManager
- 2.3 deploy 钉钉插件
- 2.4 验证
一 Docker Prometheus Grafana 监控 Spring boot项目
1.1 Springboot 集成 micrometer
- 1.1.1 pom.xml
        <dependency>
            <groupId>org.springframework.bootgroupId>
            <artifactId>spring-boot-starter-actuatorartifactId>
        dependency>
        <dependency>
            <groupId>io.micrometergroupId>
            <artifactId>micrometer-registry-prometheusartifactId>
        dependency>
- 1.1.2 application.properties
# Actuator prometheus
management.endpoints.web.exposure.include=*
# 将应用名称添加到计量器的 tag 中去,以便 Prometheus 根据应用名区分不同服务
management.metrics.tags.application=${spring.application.name}
- 1.1.3 jvm监控配置
package com.car.life.service.wallet.config

import io.micrometer.core.instrument.MeterRegistry
import org.springframework.beans.factory.annotation.Value
import org.springframework.boot.actuate.autoconfigure.metrics.MeterRegistryCustomizer
import org.springframework.context.annotation.Bean
import org.springframework.context.annotation.Configuration


/**
 * @program: car-life-project
 *
 * @description: MircoMeterConfig
 *
 * @author: loulvlin
 *
 * @create: 2021-02-22 14:01
 */
@Configuration
class MircoMeterConfig {

    @Bean
    fun configurer(
            @Value("\${spring.application.name}") applicationName: String): MeterRegistryCustomizer<MeterRegistry> {
        return MeterRegistryCustomizer { registry: MeterRegistry -> registry.config().commonTags("application", applicationName) }
    }
}
- 1.1.4 接口/actuator/prometheus权限放行
if(request.requestURI=="/actuator/prometheus" || request.requestURI=="/status"  || request.requestURI=="/favicon.ico"){
            return super.preHandle(request, response, handler)
        }
- 1.1.5 启动项目
- 1.1.6 访问接口查看监控指标数据
http://192.168.40.234:11000/actuator/prometheus
http://localhost:11000/actuator/prometheus
1.2 deploy prometheus
- 1.2.1 create folder
mkdir -p /home/prometheus/
mkdir -p /home/prometheus/rules
- 1.2.3 get prometheus.yml
cd /home/prometheus/

docker run --name prometheus -d -p 127.0.0.1:9090:9090 prom/prometheus

docker cp /etc/prometheus/prometheus.yml .

docker rm -f prometheus
- 1.2.3 modify prometheus.yml
添加一个job_name 为wallet-service的job
# A scrape configuration containing exactly one endpoint to scrape:
# Here it's Prometheus itself.
scrape_configs:
  # The job name is added as a label `job=` to any timeseries scraped from this config.
  - job_name: 'prometheus'

    # metrics_path defaults to '/metrics'
    # scheme defaults to 'http'.

    static_configs:
    - targets: ['localhost:9090']

  - job_name: 'wallet-service'
    scrape_interval: 15s
    scrape_timeout: 10s
    metrics_path: '/actuator/prometheus'
    static_configs:
      - targets: ['192.168.40.234:11000']
        "labels": {
            "instance": "wallet-service",
            "service": "car-life-project"
        }
- 1.2.4 download image and start container
如果要修改时区,需要自己构建image,参数配置不起作用
docker pull prom/prometheus

docker run --name prometheus -d --restart always \
    --hostname prometheus \
    -p 9090:9090 \
    -v /home/prometheus/prometheus.yml:/etc/prometheus/prometheus.yml \
    -v /home/prometheus/rules:/home/prometheus/rules \
    -u root prom/prometheus
- 1.2.5 访问prometheus
http://192.168.0.35:9090/targets #监控目标列表页
#查询控制台 可以查询一个指标,例如 http_server_requests_seconds_sum
http://192.168.0.35:9090/graph
1.3 deploy grafana
- 1.3.1 deploy
docker pull grafana/grafana

docker run -d --restart always \
    -p 3000:3000 \
    --name=grafana \
    grafana/grafana

# 启动后,访问:http://192.168.0.35:3000,默认用户名密码 admin/admin   新密码修改成123456
- 1.3.2 配置prometheus数据源
1. 配置中添加 Prometheus 数据源[url:http://192.168.0.35:9090/,HTTP Method
:GET]最后Save&Test
- 1.3.2 配置dashboard
1. +-->import  输入4701  或   12271[推荐]
2. 保存dashboard
3. 页面背景色--->页面左下角-->admin-->Preference
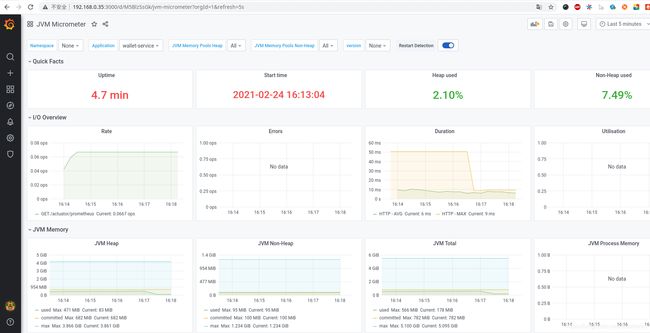
- 1.3.3 监控图
二 Docker Prometheus AlertManager webhook 报警
2.1 配置钉钉机器人
注意:如果机器人配置了多个关键字,推送到钉钉中的消息内容必须包含至少一个关键词,才能推送成功
- 2.1.1 建群"服务监控"并添加"DEV服务监控"机器人
- 为机器人配置关键字,可以配置多个关键字,比如"服务监控"
2.2 deploy alertManager
- 2.2.1 get alertmanager.yml
mkdir -p /home/alertManager && cd /home/alertManager

docker run -d --restart always --name alertmanager -p 9093:9093 prom/alertmanager

docker cp alertmanager:/etc/alertmanager/alertmanager.yml .

docker rm -f  alertmanager
- 2.2.2 modify alertmanager.yml
192.168.0.35:8060为后面prometheus-webhook-dingtalk部署的ip和端口
global:
  resolve_timeout: 5m
route:
  receiver: webhook
  group_wait: 30s
  group_interval: 5m
  repeat_interval: 5m
  group_by: [alertname]
  routes:
  - receiver: webhook
    group_wait: 10s
    match:
      team: mobile-dev
receivers:
- name: webhook
  webhook_configs:
  - url: http://192.168.0.35:8060/dingtalk/webhook1/send
    send_resolved: true
- 2.2.3 编写wallet-service告警规则
cd /home/prometheus/rules

vim wallet-service.yml
groups:
- name: wallet-service
rules:
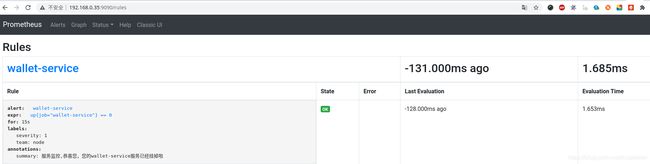
- alert: wallet-service
expr: up{job="wallet-service"} == 0
for: 15s
labels:
severity: critical
team: mobile-dev
annotations:
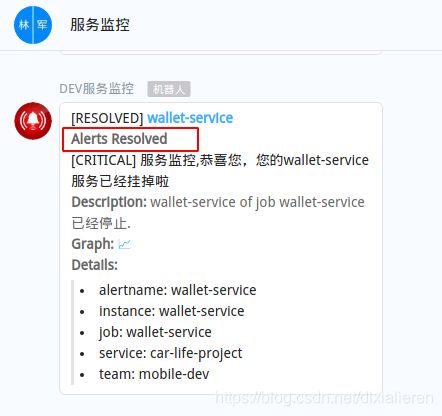
summary: "服务监控,恭喜您,您的wallet-service服务已经挂掉啦"
description: "{{$labels.instance}} of job {{$labels.job}} 已经停止."
- 2.2.4 prometheus配置告警
cd /home/prometheus

vim prometheus.yml
192.168.0.35:9093为alertmanager部署的ip和端口
# Alertmanager configuration
alerting:
  alertmanagers:
  - static_configs:
    - targets: ['192.168.0.35:9093']
      # - alertmanager:9093

# Load rules once and periodically evaluate them according to the global 'evaluation_interval'.
rule_files:
- /home/prometheus/rules/*.yml
  # - "first_rules.yml"
  # - "second_rules.yml"
删除prometheus容器并重启[由于前面已经做过rules映射配置,故重启容器即可]
docker run --name prometheus -d --restart always \
    --hostname prometheus \
    -p 9090:9090 \
    -v /home/prometheus/prometheus.yml:/etc/prometheus/prometheus.yml \
    -v /home/prometheus/rules:/home/prometheus/rules \
    -u root prom/prometheus
- 2.2.5 启动alertmanager容器
docker pull prom/alertmanager

docker run -d \
  -p 9093:9093 \
  --name alertmanager \
  --restart=always \
  -v /etc/localtime:/etc/localtime \
  -v /home/alertManager/alertmanager.yml:/etc/alertmanager/alertmanager.yml \
  prom/alertmanager
2.3 deploy 钉钉插件
- 2.3.1 获取token
https://oapi.dingtalk.com/robot/send?access_token=XXXXXX
- 2.3.2 启动插件
docker pull timonwong/prometheus-webhook-dingtalk

docker run -d --restart always -p 8060:8060 --name webhook timonwong/prometheus-webhook-dingtalk --ding.profile="webhook1=https://oapi.dingtalk.com/robot/send?access_token=XXXXXX"
2.4 验证
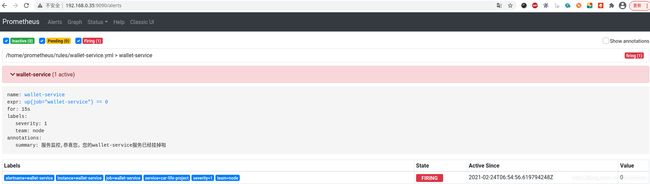
- 2.4.1 查看告警规则
http://192.168.0.35:9090/rules
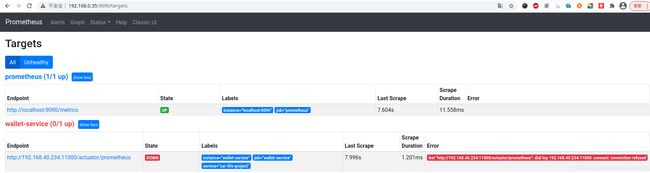
- 2.4.2 关闭服务
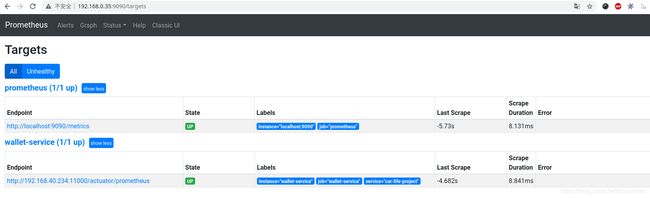
http://192.168.0.35:9090/targets

http://192.168.0.35:9090/alerts
targets
alerts
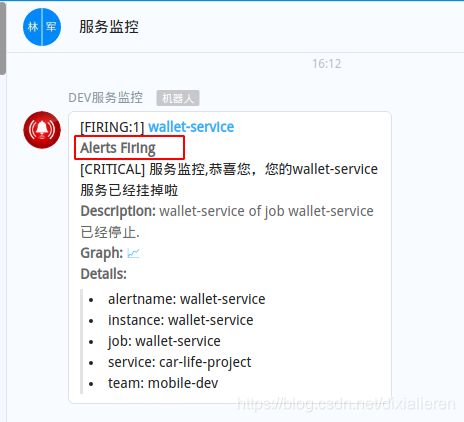
钉钉消息:
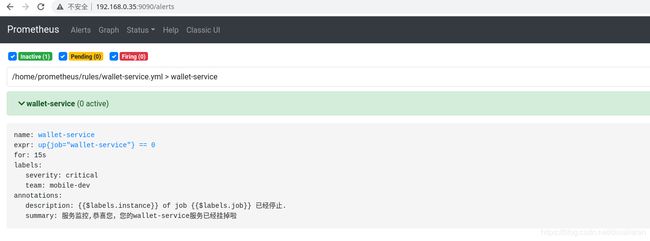
- 2.4.2 启动服务
http://192.168.0.35:9090/targets

http://192.168.0.35:9090/alerts
targets:
alerts:
钉钉消息: