Android图表库XCL-Charts
首先,这个是国人开发的,支持下必须顶!github项目地址:点击打开,由于项目的基本功能已经实现,所以项目作者也说以后基本不会在有更新了。
项目简介:
Android图表库(XCL-Charts is a free charting library for Android platform.),基于Android Canvas来绘制各种图表,使用简便,定制灵活。目前支持3D/非3D/背向式/横向/竖向柱形图(Bar Chart)、3D/非3D饼图(Pie Chart)、堆叠图(Stacked Bar Chart)、面积图(Area Chart)、 折线图(Line Chart)、曲线图(Spline Chart)、环形图(Dount Chart)、南丁格尔玫瑰图(Rose Chart)、仪表盘(Dial Chart)、刻度盘(Gauge Chart)、雷达图(Radar Chart)、漏斗图(Funnel Chart)、圆形图(Circle Chart)等。该项目作者的CSDN博客地址:点击打开
其它特性还包括手势缩放、图表滑动、点击交互、多图叠加、图表批注、动画效果、多XY轴显示、轴线任意方位显示、动态图例、图表参考线、柱图刻度对齐风格切换、混合图表及同数据源图表类型切换等。
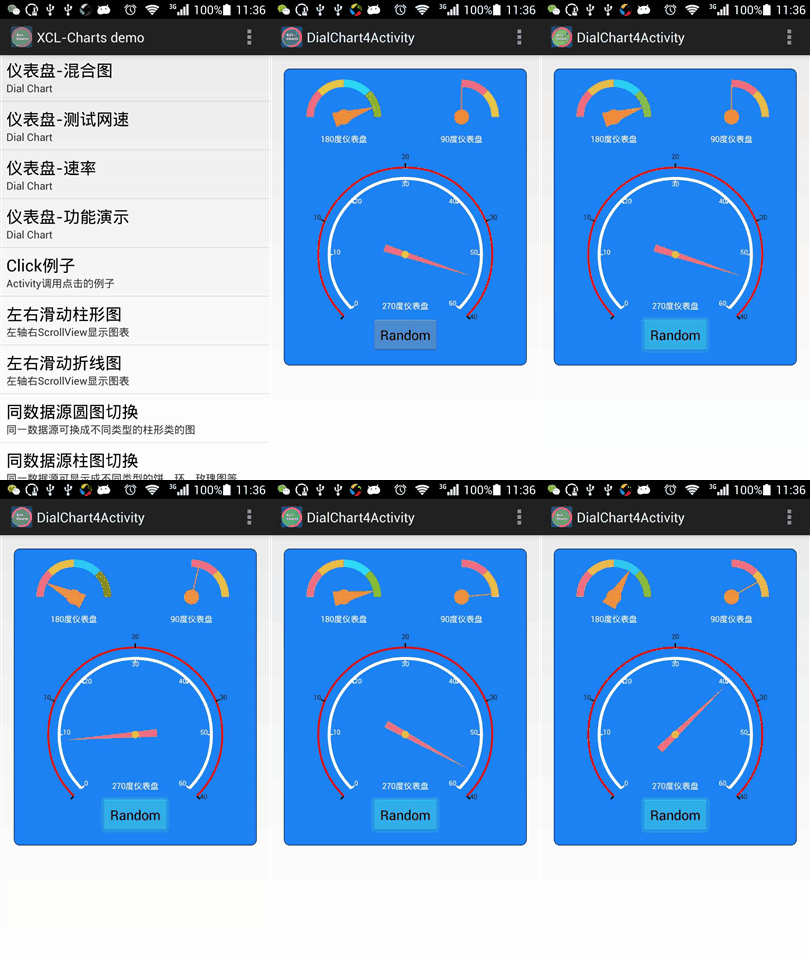
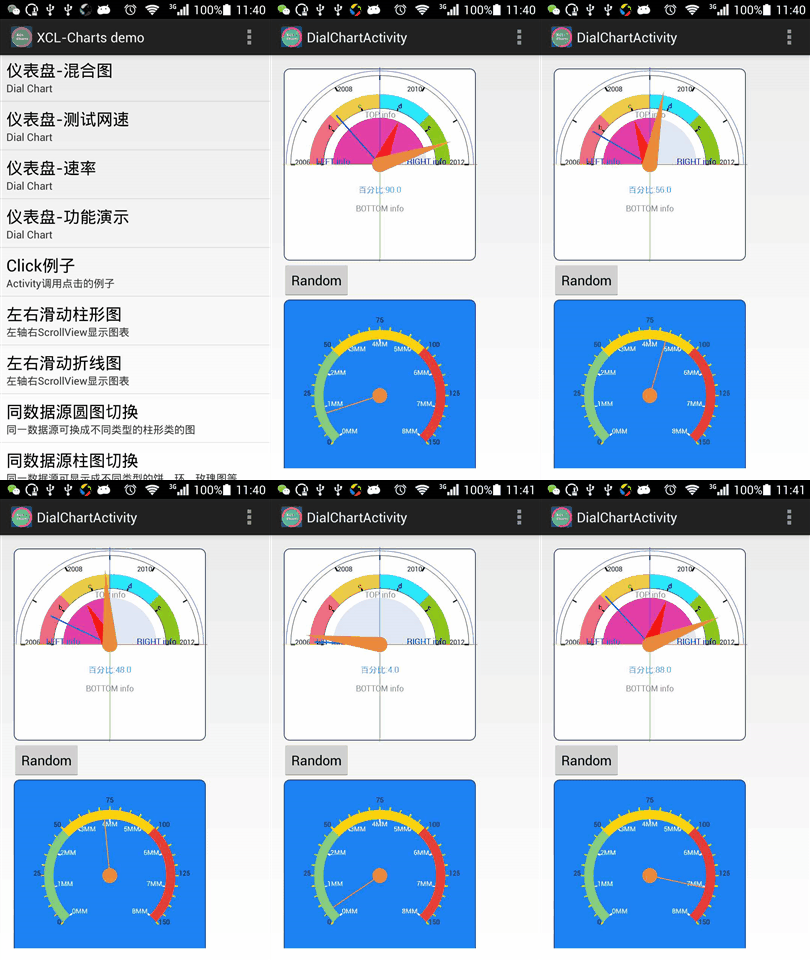
效果图:我在这里只放一些,其他的效果你可以参考项目地址,我首先试用了一下仪表盘动画


不足的地方:作者没有一般的使用方法,在他的博客厘米爱你只是简单介绍了一些方法的说明,可能是我水平不够,或者是看的老外的github项目多的原因,不过在这里我还是图草下(擦,google拼音连个吐槽都不能识别了吗);下面说的一般使用方法,参考了作者的demo
先建一个封装类DialChart02View.java,(里面的用法不懂的可以参考作者的博客)

  1 package com.example.dashchart;

  2

  3 import java.util.ArrayList;

  4 import java.util.List;

  5

  6 import org.xclcharts.chart.DialChart;

  7 import org.xclcharts.common.MathHelper;

  8 import org.xclcharts.renderer.XEnum;

  9 import org.xclcharts.renderer.plot.PlotAttrInfo;

 10 import org.xclcharts.view.GraphicalView;

 11

 12 import android.content.Context;

 13 import android.graphics.Canvas;

 14 import android.graphics.Color;

 15 import android.graphics.Paint;

 16 import android.graphics.Paint.Align;

 17 import android.util.AttributeSet;

 18 import android.util.Log;

 19

 20

 21 public class DialChart02View extends GraphicalView {

 22

 23     private String TAG = "DialChart02View";

 24     private DialChart chart = new DialChart();

 25     private float mPercentage = 0.9f;

 26

 27     public DialChart02View(Context context) {

 28         super(context);

 29         // TODO Auto-generated constructor stub

 30         initView();

 31     }

 32

 33     public DialChart02View(Context context, AttributeSet attrs){

 34         super(context, attrs);

 35         initView();

 36      }

 37

 38      public DialChart02View(Context context, AttributeSet attrs, int defStyle) {

 39             super(context, attrs, defStyle);

 40             initView();

 41      }

 42

 43

 44      private void initView()

 45      {

 46         chartRender();

 47      }

 48

 49      @Override

 50         protected void onSizeChanged(int w, int h, int oldw, int oldh) {

 51             super.onSizeChanged(w, h, oldw, oldh);

 52             chart.setChartRange(w ,h );

 53         }

 54

 55         public void chartRender()

 56         {

 57             try {

 58

 59                 //设置标题背景

 60                 chart.setApplyBackgroundColor(true);

 61                 chart.setBackgroundColor( Color.rgb(47, 199, 140) );

 62                 //绘制边框

 63                 chart.showRoundBorder();

 64

 65                 //设置当前百分比

 66                 //chart.setCurrentPercentage(mPercentage);

 67

 68                 //设置指针长度

 69                 chart.getPointer().setLength(0.68f);

 70

 71                 //增加轴

 72                 addAxis();

 73                 /////////////////////////////////////////////////////////////

 74                 //设置附加信息

 75                 addAttrInfo();

 76                 /////////////////////////////////////////////////////////////

 77

 78                 chart.getPointer().setPercentage(mPercentage);

 79

 80                 chart.getPointer().getPointerPaint().setColor(Color.WHITE);

 81                 chart.getPointer().getBaseCirclePaint().setColor(Color.WHITE);

 82                 //chart.getPointer().setPointerStyle(XEnum.PointerStyle.TRIANGLE);

 83

 84                 chart.getPointer().setPercentage(mPercentage/2);

 85

 86

 87             } catch (Exception e) {

 88                 // TODO Auto-generated catch block

 89                 Log.e(TAG, e.toString());

 90             }

 91

 92         }

 93

 94         public void addAxis()

 95         {

 96             //开始设置轴

 97             //轴1 --最外面的弧线轴

 98             chart.addArcLineAxis(1);

 99

100             //轴3 --环形颜色轴

101             List<Float> ringPercentage = new ArrayList<Float>();

102             float rper = MathHelper.getInstance().sub(1,mPercentage);

103             ringPercentage.add( mPercentage);

104             ringPercentage.add( rper);

105

106             List<Integer> rcolor  = new ArrayList<Integer>();

107             rcolor.add(Color.rgb(222, 248, 239));

108             rcolor.add(Color.rgb(99, 214, 173));

109             chart.addStrokeRingAxis(0.8f,0.7f, ringPercentage, rcolor);

110

111

112             chart.addLineAxis(XEnum.Location.TOP,0.3f);

113             chart.addLineAxis(XEnum.Location.LEFT,0.3f);

114             chart.addLineAxis(XEnum.Location.RIGHT,0.3f);

115             if(chart.getPlotAxis().size() >= 2)

116             {

117                 chart.getPlotAxis().get(2).getAxisPaint().setColor(Color.BLUE);

118                 chart.getPlotAxis().get(2).getAxisPaint().setStrokeWidth(5);

119             }

120             if(chart.getPlotAxis().size() >= 3)

121             {

122                 chart.getPlotAxis().get(3).getAxisPaint().setColor(Color.GREEN);

123                 chart.getPlotAxis().get(3).getAxisPaint().setStrokeWidth(5);

124             }

125             if(chart.getPlotAxis().size() >= 4)

126             {

127                 chart.getPlotAxis().get(4).getAxisPaint().setColor(Color.YELLOW);

128                 chart.getPlotAxis().get(4).getAxisPaint().setStrokeWidth(5);

129             }

130

131

132

133             chart.getPlotAxis().get(0).getAxisPaint().setColor(Color.WHITE );

134             chart.getPlotAxis().get(0).getAxisPaint().setStrokeWidth(2);

135             chart.getPlotAxis().get(1).getFillAxisPaint().setColor(Color.rgb(47, 199, 140) );

136

137             chart.addCircleAxis(0.2f,Color.rgb(62, 175, 135));

138             chart.addCircleAxis(0.15f,Color.rgb(28, 111, 84));

139         }

140

141

142         private void addAttrInfo()

143         {

144             /////////////////////////////////////////////////////////////

145             PlotAttrInfo plotAttrInfo = chart.getPlotAttrInfo();

146

147             //设置附加信息

148             Paint paintTB = new Paint();

149             paintTB.setColor(Color.WHITE);

150             paintTB.setTextAlign(Align.CENTER);

151             paintTB.setTextSize(30);

152             plotAttrInfo.addAttributeInfo( XEnum.Location.TOP, "100 K/s", 0.9f, paintTB);

153

154             Paint paintBT = new Paint();

155             paintBT.setColor(Color.WHITE);

156             paintBT.setTextAlign(Align.CENTER);

157             paintBT.setTextSize(30);

158

159

160             plotAttrInfo.addAttributeInfo(XEnum.Location.BOTTOM,

161                     "当前PH值: "+Float.toString( mPercentage * 100)+"K/s", 0.8f, paintBT);

162         }

163

164         public void setCurrentStatus(float percentage)

165         {

166             //清理

167             chart.clearAll();

168

169             mPercentage =  percentage;

170             //设置当前百分比

171             chart.getPointer().setPercentage(mPercentage);

172             addAxis();

173             addAttrInfo();

174         }

175

176

177         @Override

178         public void render(Canvas canvas) {

179             // TODO Auto-generated method stub

180              try{

181                     chart.render(canvas);

182

183                 } catch (Exception e){

184                     Log.e(TAG, e.toString());

185                 }

186         }

187 }
其次就是在主activity.java中调用了,首先在布局文件中自定义标签
    <com.example.dashchart.DialChart02View

        android:id="@+id/circle_view"

        android:layout_width="fill_parent"

        android:layout_height="250dip" />
话说这个标签好奇特,需要和自定义的类做标签,我也是醉了,下面就是MainActivity.java标签了
package com.example.dashchart;


import java.util.Random;


import android.app.Activity;

import android.os.Bundle;

import android.view.Menu;

import android.view.MenuItem;

import android.view.View;

import android.view.View.OnClickListener;

import android.widget.Button;

import com.example.dashchart.DialChart02View;


public class MainActivity extends Activity {

    DialChart02View chart = null;

    Button button;


    @Override

    protected void onCreate(Bundle savedInstanceState) {

        super.onCreate(savedInstanceState);

        setContentView(R.layout.activity_main);

        chart = (DialChart02View) findViewById(R.id.circle_view);

        button = (Button) findViewById(R.id.button1);

        button.setOnClickListener(new OnClickListener() {


            @Override

            public void onClick(View arg0) {

                // TODO Auto-generated method stub

                int max = 100;

                int min = 1;

                Random random = new Random();

                int p = random.nextInt(max) % (max - min + 1) + min;

                float pf = p / 100f;

                chart.setCurrentStatus(pf);

                chart.invalidate();


            }

        });

    }


    @Override

    public boolean onCreateOptionsMenu(Menu menu) {

        // Inflate the menu; this adds items to the action bar if it is present.

        getMenuInflater().inflate(R.menu.main, menu);

        return true;

    }


    @Override

    public boolean onOptionsItemSelected(MenuItem item) {

        // Handle action bar item clicks here. The action bar will

        // automatically handle clicks on the Home/Up button, so long

        // as you specify a parent activity in AndroidManifest.xml.

        int id = item.getItemId();

        if (id == R.id.action_settings) {

            return true;

        }

        return super.onOptionsItemSelected(item);

    }

}
效果图:改天在放吧,其实差不多,区别就是根据你的需要修改一些自定义的东西,有时间在好好研究下作者的代码,最后还是特别感谢项目作者的开源精神,在这里也是帮作者宣传下!
2015-05-02 08:08:05
