- 如何在编辑器wangEditor中完美复制粘贴WORD内容?
M_Snow
编辑器wordumeditor粘贴wordueditor粘贴wordueditor复制wordueditor上传word图片ueditor导入word
要求:开源,免费,技术支持编辑器:wangEditor前端:vue2,vue3,vue-cli,html5后端:java,jsp,springboot,asp.net,php,asp,.netcore,.netmvc,.netform群体:学生,个人用户,外包,自由职业者,中小型网站,博客,场景:数字门户,数字中台,站群,内网,外网,信创国产化环境,web截屏行业:医疗,教育,建筑,政府,党政,国
- 网页版wangEditor如何实现WORD图片的高效粘贴?
M_Snow
wordumeditor粘贴wordueditor粘贴wordueditor复制wordueditor上传word图片ueditor导入wordueditor导入pdf
要求:开源,免费,技术支持编辑器:wangEditor前端:vue2,vue3,vue-cli,html5后端:java,jsp,springboot,asp.net,php,asp,.netcore,.netmvc,.netform群体:学生,个人用户,外包,自由职业者,中小型网站,博客,场景:数字门户,数字中台,站群,内网,外网,信创国产化环境,web截屏行业:医疗,教育,建筑,政府,党政,国
- ASP.NET Core通过Websocket建立简单聊天室
什么是websocket?传统的HTTP协议是一个请求-响应协议,也即是由浏览器主动向服务器发起请求,随后服务器才能进行响应这个请求,再把数据发送给浏览器。也就是说,浏览器不主动发起请求,服务器是不能主动发送数据给浏览器的,很明显,这并不能满足实时聊天的需求。满足这个需求的解法总体来说有三种:轮询、长连接、Comet轮询:轮询是指浏览器通过JavaScript启动一个定时器,然后以固定的间隔给服务
- 前后端分离与不分离解析,很全面!
涔溪
前端
从多个维度对前后端分离与不分离进行更加深入、系统的分析,包括技术架构、开发流程、部署维护、性能优化、团队协作、适用场景等方面全面理解两者的区别和优劣。一、概念定义1.前后端不分离(传统服务端渲染)前端页面由服务器端生成并返回给浏览器,如PHP、JSP、ASP.NET等。前端逻辑和后端业务耦合在一起,通常一个请求对应一个完整的HTML页面。2.前后端分离(现代Web开发模式)前端独立开发为一个完整的
- vue3 vs asp.net mvc
fyifei0558
开发语言
package.json≈.csprojpackage-lock.json≈packages.lock.jsonvite.config.js≈Startup.cs/Program.cs/configfilesindex.html≈_Layout.cshtmlpublic/≈wwwroot/
- 【ASP.NET Core】配置应用程序地址的N多种方法
pythonxxoo
计算机asp.netflaskpython计算机
优质资源分享学习路线指引(点击解锁)知识定位人群定位Python实战微信订餐小程序进阶级本课程是pythonflask+微信小程序的完美结合,从项目搭建到腾讯云部署上线,打造一个全栈订餐系统。Python量化交易实战入门级手把手带你打造一个易扩展、更安全、效率更高的量化交易系统下面又到了老周误人子弟的时间,今天要误大伙的话题是:找找有多少种方法可以设置ASP.NETCore应用的地址,即URL。精
- 第2章 大话 ASP.NET Core 入门
代数狂人
ASP.NETCore框架之旅后端ASP.NETCore.net
第1章框架学习的基石与实战策略第2章大话ASP.NETCore入门第3章创建最小(MinimalAPIs)API应用程序第4章.NET8.0ASP.NETCore图书管理系统:项目布局</
- ASP.NET Core 健康监控:从入门到实战
Net分享
asp.net后端
在ASP.NETCore中,HealthCheck是一种用于监控应用程序运行状况的内置机制。允许你定义和运行检查,以确保你的应用程序及其依赖项(如数据库、缓存、外部服务等)正常运行。HealthCheck通常用于微服务架构、容器化环境(如Kubernetes)或需要高可用性的场景。简介HealthCheck提供了一种标准化的方式,通过HTTP端点(通常是/health)返回应用程序的健康状态。He
- B/S架构在线文件管理系统开发实战
大数据无毛兽
本文还有配套的精品资源,点击获取简介:本文介绍了一种基于浏览器/服务器(B/S)模式的在线文件管理系统,使用C#和ASP.NET技术构建,实现了无需客户端软件即可通过Web界面管理文件。系统提供了用户认证、权限管理、文件上传下载、在线预览、文件夹管理、搜索、版本控制、操作日志、安全措施和性能优化等功能,强调了C#和ASP.NET在Web应用开发中的优势和实现细节。1.B/S架构文件管理系统概述在当
- prism项目搭建 wpf_使用asp.net core webapi 与 vue 搭建桌面客户端的新尝试
绘画窝
prism项目搭建wpf
制作桌面程序的技术非常多Qt,windowsForm,WPF,Electron,flutter等等由于制作可视化以及设置表单什么的用前端技术实在是太方便了,用原生拖控件也不是不行,WPF设计模式也真的很帅,但....奈何一个没有精力维护,一方面还没有点开技能树,另一方面也为了迁就跨平台的能力,所以界面还是希望使用的网页技术制作。使用大家常说的electron时,发现调用c++code时不是很友好,
- ZSEmail 邮件收发系统的ASP.NET MVC与.NET框架实现
瞬泉
本文还有配套的精品资源,点击获取简介:ZSEmail是一款使用ASP.NETMVC和.NET框架开发的邮件管理平台,集成了收件箱、发件箱、草稿箱等核心功能,为用户提供便捷和安全的电子邮件处理体验。系统采用MVC设计模式和.NET框架的优势,实现了邮件的高效收发,并具备稳定安全的网络通信、身份验证和授权机制。此外,ZSEmail可能利用了SMTP、POP3和IMAP4协议,并通过AJAX技术优化用户
- 异步编程实战:使用C#实现FTP文件下载及超时控制
博客标题:异步编程实战:使用C#实现FTP文件下载及超时控制如果你的函数不是async,你仍然可以实现相同的超时功能,但你将不得不依赖更多的同步代码或使用.Result或.GetAwaiter().GetResult()来阻塞等待任务完成,这可能导致死锁的风险,特别是在UI线程或ASP.NET上下文中。不过,在一些简单的后台任务或控制台应用程序中,这种方法可能是可行的。以下是如何在非异步函数中实现
- C#转PHP,为什么?
qq_16490557
个人日志
做了多年的程序了,从C#转PHP,完全是出乎意料,虽然不杂想改变自己的程序语言,但是社会是残酷的,学的人越多了,招聘的公司,就觉得那个东西一文不值,程序员到处都是学C#的。ASP.NET转PHP,为什么?原因有几点:1、PHP可以运行在Linux下,在运行平台上,更安全,运行速度更快,这是ASP.NET#比不到的2、PHP环境APACHE,跟IIS比,大家都知道了,不用我多说。优点太多3、PHP不
- ASP.NET Core JWT鉴权:用代码铸造“防弹令牌”,让黑客在401地狱门外哭泣!
墨夶
C#学习资料asp.net后端
1.API的“中二危机”与JWT核武器的救赎被黑客爆破的API崩溃了:“100个请求/秒?这要算到宇宙热寂!”//JWT核武器启动services.AddJwtBearer(options=>{options.RequireHttpsMetadata=true;//HTTPS防弹衣options.TokenValidationParameters=newTokenValidationParamet
- C# WebAPI中的Token认证与数字签名实现
本文还有配套的精品资源,点击获取简介:WebAPI是基于ASP.NET的RESTful服务框架,Token用于身份验证和授权,而数字签名用于验证数据的完整性和身份。本项目详细介绍了在C#WebAPI中结合Token和数字签名的实现方法,包括JWT的生成、身份验证流程、数字签名的使用、Token刷新机制以及相关的安全措施。1.WebAPI框架介绍WebAPI框架的定义WebAPI(Web应用程序编程
- 高级软件工程师的新面试问题
我在帮一位失业的朋友汇总一些面试练习问题。亲爱的读者,我想如果能从你们那里收集一些问题的话会比较有用。这些问题应该更多注重软件设计,而不太像我之前的两个面试问题列表那样关注技术细节。伟大的.NET开发人员应该知道些什么(更多面试问题)ASP.NET面试问题(你能相信吗?7年以前发表的)更新:我想我们都赞同假如你明天要去面试,看着桌子对面的面试官简单地将这份列表打印出来照着念,那么你就应该找个借口马
- 在ASP.NET中读写Excel文件
独孤大虾
DotNet文章excelasp.netopenxmlofficemicrosoft文档
在ASP.NET应用程序常常会遇到需要从Excel文件中读取数据或将数据写入Excel的需求。一般来讲,在ASP.NET中读写Excel文件有四种解决方案。1.1.1使用OLEDB使用OLEDB可以以查询数据库的方式来读取Excel文件,因为在某种程度上Excel表格可以看成是一张一张的数据表。其二者的主要区别在于所使用的数据引擎不一样。使用OLEDB访问Excel的要点是计算机上必须具有Micr
- 如何将WORD文档中的图片转存到wangEditor编辑器中?
M_Snow
word编辑器umeditor粘贴wordueditor粘贴wordueditor复制wordueditor上传word图片ueditor导入word
要求:开源,免费,技术支持编辑器:wangEditor前端:vue2,vue3,vue-cli,html5后端:java,jsp,springboot,asp.net,php,asp,.netcore,.netmvc,.netform群体:学生,个人用户,外包,自由职业者,中小型网站,博客,场景:数字门户,数字中台,站群,内网,外网,信创国产化环境,web截屏行业:医疗,教育,建筑,政府,党政,国
- 前端wangEditor如何实现WORD文档的完整导入?
全武凌(荆门泽优)
前端wordumeditor粘贴wordueditor粘贴wordueditor复制wordueditor上传word图片ueditor导入word
要求:开源,免费,技术支持编辑器:wangEditor前端:vue2,vue3,vue-cli,html5后端:java,jsp,springboot,asp.net,php,asp,.netcore,.netmvc,.netform群体:学生,个人用户,外包,自由职业者,中小型网站,博客,场景:数字门户,数字中台,站群,内网,外网,信创国产化环境,web截屏行业:医疗,教育,建筑,政府,党政,国
- C#与ASP.NET 2020面试题精编及实战指南
月末刀戈
本文还有配套的精品资源,点击获取简介:本资料集《C#笔试面试题集锦2020》旨在帮助开发者准备C#及ASP.NET相关技术的面试,内容涉及C#基础语法、面向对象编程、异常处理等多个核心领域。涵盖了从基础到高级的各种面试知识点,并提供有关内存管理、多线程、网络编程、数据库操作等方面的深入理解。同时,详细介绍了ASP.NETWeb应用程序开发的关键组件和概念,以及Web服务和API、设计模式的应用。通
- ASP.NET Core MVC 中 Identity 框架的深度应用与实战指南
caifox菜狐狸
C#技术使用笔记asp.netmvcasp.netcoreIdentity身份验证授权角色
在当今的数字化时代,用户身份管理和认证是现代Web应用程序的核心需求之一。无论是企业级应用还是面向大众的平台,都需要确保用户能够安全、便捷地访问系统,同时保护他们的个人信息和隐私。ASP.NETCoreMVC提供了一个强大且灵活的身份管理框架——Identity,它不仅简化了用户认证和授权的开发工作,还提供了丰富的功能来满足各种复杂的应用场景。本教程将深入探讨ASP.NETCoreMVC中Iden
- Windows 和 Linux 系统搭建网站的选型
在Windows和Linux系统下搭建网站的形式各有特点,以下是基于系统特性和主流技术的详细对比与实践方案:一、Windows系统搭建网站的核心形式1.IIS服务器原生支持:WindowsServer系统内置IIS(InternetInformationServices),开箱即用,支持ASP.NET、ASP、PHP等多种技术栈。核心功能:HTTP/2协议:IIS10.0及以上版本支持HTTP/2
- ASP.NET Core 中的分布式缓存 IDistributedCache
忆水思寒
缓存asp.net分布式
ASP.NETCore中的缓存内存(MemoryCache)ASP.NETCore中的分布式缓存响应缓存在ASP.NETCore中的中间件分布式Redis缓存分布式SQLServer缓存CacheGitHub地址NetFramewoke中常用的缓存有两种:System.Runtime.Caching和System.Web.CachingNETCore中缓存相关的类库都在:Microsoft.Ext
- ASP.NET Core 模型验证消息的本地化新姿势详解
~风清扬~
C#遗忘系列.NetCore相关asp.net后端c#
本文介绍了如何在ASP.NETCore中对模型验证消息进行本地化,默认情况下,验证消息是英文的,不方便用户理解,通过自定义资源类并将其放入项目中,可以实现验证消息的本地化,这样无需为每个模型手动指定错误消息,提升了开发效率,感兴趣的朋友一起看看吧疑问产生在MVC模型下,我们会使用模型类对请求参数进行绑定和验证。举个例子:publicclassUserDto{[Required(ErrorMessa
- ASP.NET Core 中的分布式缓存 IDistributedCache IMemoryCache
KingCruel
.NETCoreASP.NETCoreASP.NETCore分布式缓存
ASP.NETCore中的缓存内存(MemoryCache)ASP.NETCore中的分布式缓存响应缓存在ASP.NETCore中的中间件分布式Redis缓存分布式SQLServer缓存CacheGitHub地址NetFramewoke中常用的缓存有两种:System.Runtime.Caching和System.Web.CachingNETCore中缓存相关的类库都在:Microsoft.Ext
- ASP.NET Core 中快速读取配置的最佳实践
A_nanda
c#基础C#开源架构分析asp.net后端配置读取
在ASP.NETCore应用中,配置管理是一个核心部分。为了实现高性能、类型安全且易于维护的配置读取方式,我们可以结合IConfiguration和选项模式(OptionsPattern)进行优化。本文将介绍几种高效读取配置的方法,并提供性能优化建议和高级技巧。一、使用IConfiguration直接读取配置这是最基础也是最直接的方式,适用于简单场景下的快速获取配置值。示例代码://appsett
- ASP.NET服务端操作ActiveX 实战宝典
f7anty
Activexasp.netwinformdllwindowsjavascriptweb
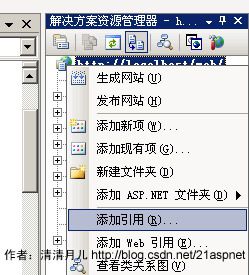
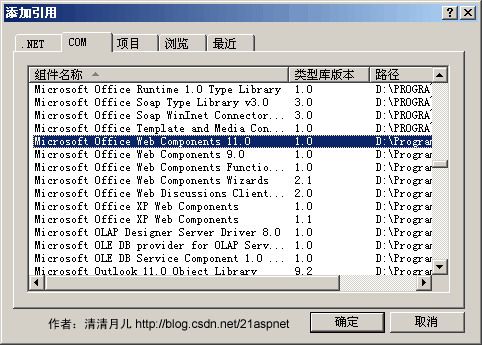
大家都只ActiveX在web中可以通过object标签来声明,并通过javascript等脚本代码来进行操作,但有些时候我们希望在服务端在操作ActiveX,特别是包含一些复杂的业务逻辑的或要对大数据量进行操作的。通常某些控件是可以通过添加引用=》COM,使用VisualStudio来生成包装类来进行调用,但有些则不行,包装类可以进行初始化,但访问属性或方法时都会运行报错,错误信息为“灾难性故障
- VS2022 ASP.NET core Web API 示例代码解释
web13508588635
asp.net前端后端
0.项目结构在创建ASP.NETCoreWebAPI项目后,项目的基本结构如下:MyWebApiProject│Controllers│└──WeatherForecastController.cs│Program.cs│WeatherForecast.cs│appsettings.json│...1.Program.cs这个文件是应用程序的入口点,负责配置和启动Web服务器。varbuilder
- 如何在ASP.Net Core中自动进行模型验证
cxu0262
javapythonlinuxvuespringViewUI
当我们创建接受用户数据的应用程序时,我们必须先验证该数据,然后再将其存储在数据库中。.NetFramework不仅提供验证属性以简化对所需输入,数据类型,值范围和模式(例如电子邮件地址和信用卡号)的检查,而且ASP.NetCore可以自动检查提交HTML表单值中的验证错误。ASP.NetCore中的模型状态是名称-值对以及验证信息的集合,这些信息在POST请求期间发送到服务器。验证信息中包含的任何
- .NET10:asp.net core mini api中的验证
步、步、为营
.netasp.netjava
.NET10:ASP.NETCoreMiniAPI中的验证技术揭秘在当今的Web开发领域,ASP.NETCoreMiniAPI以其简洁、高效的特点,成为了众多开发者的心头好。而在.NET10中,MiniAPI的验证功能更是得到了进一步的优化和完善。今天,我们就来深入探讨一下.NET10里ASP.NETCoreMiniAPI中的验证技术。一、MiniAPI验证的重要性在构建API时,数据验证是至关重
- sql统计相同项个数并按名次显示
朱辉辉33
javaoracle
现在有如下这样一个表:
A表
ID Name time
------------------------------
0001 aaa 2006-11-18
0002 ccc 2006-11-18
0003 eee 2006-11-18
0004 aaa 2006-11-18
0005 eee 2006-11-18
0004 aaa 2006-11-18
0002 ccc 20
- Android+Jquery Mobile学习系列-目录
白糖_
JQuery Mobile
最近在研究学习基于Android的移动应用开发,准备给家里人做一个应用程序用用。向公司手机移动团队咨询了下,觉得使用Android的WebView上手最快,因为WebView等于是一个内置浏览器,可以基于html页面开发,不用去学习Android自带的七七八八的控件。然后加上Jquery mobile的样式渲染和事件等,就能非常方便的做动态应用了。
从现在起,往后一段时间,我打算
- 如何给线程池命名
daysinsun
线程池
在系统运行后,在线程快照里总是看到线程池的名字为pool-xx,这样导致很不好定位,怎么给线程池一个有意义的名字呢。参照ThreadPoolExecutor类的ThreadFactory,自己实现ThreadFactory接口,重写newThread方法即可。参考代码如下:
public class Named
- IE 中"HTML Parsing Error:Unable to modify the parent container element before the
周凡杨
html解析errorreadyState
错误: IE 中"HTML Parsing Error:Unable to modify the parent container element before the child element is closed"
现象: 同事之间几个IE 测试情况下,有的报这个错,有的不报。经查询资料后,可归纳以下原因。
- java上传
g21121
java
我们在做web项目中通常会遇到上传文件的情况,用struts等框架的会直接用的自带的标签和组件,今天说的是利用servlet来完成上传。
我们这里利用到commons-fileupload组件,相关jar包可以取apache官网下载:http://commons.apache.org/
下面是servlet的代码:
//定义一个磁盘文件工厂
DiskFileItemFactory fact
- SpringMVC配置学习
510888780
springmvc
spring MVC配置详解
现在主流的Web MVC框架除了Struts这个主力 外,其次就是Spring MVC了,因此这也是作为一名程序员需要掌握的主流框架,框架选择多了,应对多变的需求和业务时,可实行的方案自然就多了。不过要想灵活运用Spring MVC来应对大多数的Web开发,就必须要掌握它的配置及原理。
一、Spring MVC环境搭建:(Spring 2.5.6 + Hi
- spring mvc-jfreeChart 柱图(1)
布衣凌宇
jfreechart
第一步:下载jfreeChart包,注意是jfreeChart文件lib目录下的,jcommon-1.0.23.jar和jfreechart-1.0.19.jar两个包即可;
第二步:配置web.xml;
web.xml代码如下
<servlet>
<servlet-name>jfreechart</servlet-nam
- 我的spring学习笔记13-容器扩展点之PropertyPlaceholderConfigurer
aijuans
Spring3
PropertyPlaceholderConfigurer是个bean工厂后置处理器的实现,也就是BeanFactoryPostProcessor接口的一个实现。关于BeanFactoryPostProcessor和BeanPostProcessor类似。我会在其他地方介绍。PropertyPlaceholderConfigurer可以将上下文(配置文件)中的属性值放在另一个单独的标准java P
- java 线程池使用 Runnable&Callable&Future
antlove
javathreadRunnablecallablefuture
1. 创建线程池
ExecutorService executorService = Executors.newCachedThreadPool();
2. 执行一次线程,调用Runnable接口实现
Future<?> future = executorService.submit(new DefaultRunnable());
System.out.prin
- XML语法元素结构的总结
百合不是茶
xml树结构
1.XML介绍1969年 gml (主要目的是要在不同的机器进行通信的数据规范)1985年 sgml standard generralized markup language1993年 html(www网)1998年 xml extensible markup language
- 改变eclipse编码格式
bijian1013
eclipse编码格式
1.改变整个工作空间的编码格式
改变整个工作空间的编码格式,这样以后新建的文件也是新设置的编码格式。
Eclipse->window->preferences->General->workspace-
- javascript中return的设计缺陷
bijian1013
JavaScriptAngularJS
代码1:
<script>
var gisService = (function(window)
{
return
{
name:function ()
{
alert(1);
}
};
})(this);
gisService.name();
&l
- 【持久化框架MyBatis3八】Spring集成MyBatis3
bit1129
Mybatis3
pom.xml配置
Maven的pom中主要包括:
MyBatis
MyBatis-Spring
Spring
MySQL-Connector-Java
Druid
applicationContext.xml配置
<?xml version="1.0" encoding="UTF-8"?>
&
- java web项目启动时自动加载自定义properties文件
bitray
javaWeb监听器相对路径
创建一个类
public class ContextInitListener implements ServletContextListener
使得该类成为一个监听器。用于监听整个容器生命周期的,主要是初始化和销毁的。
类创建后要在web.xml配置文件中增加一个简单的监听器配置,即刚才我们定义的类。
<listener>
<des
- 用nginx区分文件大小做出不同响应
ronin47
昨晚和前21v的同事聊天,说到我离职后一些技术上的更新。其中有个给某大客户(游戏下载类)的特殊需求设计,因为文件大小差距很大——估计是大版本和补丁的区别——又走的是同一个域名,而squid在响应比较大的文件时,尤其是初次下载的时候,性能比较差,所以拆成两组服务器,squid服务于较小的文件,通过pull方式从peer层获取,nginx服务于较大的文件,通过push方式由peer层分发同步。外部发布
- java-67-扑克牌的顺子.从扑克牌中随机抽5张牌,判断是不是一个顺子,即这5张牌是不是连续的.2-10为数字本身,A为1,J为11,Q为12,K为13,而大
bylijinnan
java
package com.ljn.base;
import java.util.Arrays;
import java.util.Random;
public class ContinuousPoker {
/**
* Q67 扑克牌的顺子 从扑克牌中随机抽5张牌,判断是不是一个顺子,即这5张牌是不是连续的。
* 2-10为数字本身,A为1,J为1
- 翟鸿燊老师语录
ccii
翟鸿燊
一、国学应用智慧TAT之亮剑精神A
1. 角色就是人格
就像你一回家的时候,你一进屋里面,你已经是儿子,是姑娘啦,给老爸老妈倒怀水吧,你还觉得你是老总呢?还拿派呢?就像今天一样,你们往这儿一坐,你们之间是什么,同学,是朋友。
还有下属最忌讳的就是领导向他询问情况的时候,什么我不知道,我不清楚,该你知道的你凭什么不知道
- [光速与宇宙]进行光速飞行的一些问题
comsci
问题
在人类整体进入宇宙时代,即将开展深空宇宙探索之前,我有几个猜想想告诉大家
仅仅是猜想。。。未经官方证实
1:要在宇宙中进行光速飞行,必须首先获得宇宙中的航行通行证,而这个航行通行证并不是我们平常认为的那种带钢印的证书,是什么呢? 下面我来告诉
- oracle undo解析
cwqcwqmax9
oracle
oracle undo解析2012-09-24 09:02:01 我来说两句 作者:虫师收藏 我要投稿
Undo是干嘛用的? &nb
- java中各种集合的详细介绍
dashuaifu
java集合
一,java中各种集合的关系图 Collection 接口的接口 对象的集合 ├ List 子接口 &n
- 卸载windows服务的方法
dcj3sjt126com
windowsservice
卸载Windows服务的方法
在Windows中,有一类程序称为服务,在操作系统内核加载完成后就开始加载。这里程序往往运行在操作系统的底层,因此资源占用比较大、执行效率比较高,比较有代表性的就是杀毒软件。但是一旦因为特殊原因不能正确卸载这些程序了,其加载在Windows内的服务就不容易删除了。即便是删除注册表中的相 应项目,虽然不启动了,但是系统中仍然存在此项服务,只是没有加载而已。如果安装其他
- Warning: The Copy Bundle Resources build phase contains this target's Info.plist
dcj3sjt126com
iosxcode
http://developer.apple.com/iphone/library/qa/qa2009/qa1649.html
Excerpt:
You are getting this warning because you probably added your Info.plist file to your Copy Bundle
- 2014之C++学习笔记(一)
Etwo
C++EtwoEtwoiterator迭代器
已经有很长一段时间没有写博客了,可能大家已经淡忘了Etwo这个人的存在,这一年多以来,本人从事了AS的相关开发工作,但最近一段时间,AS在天朝的没落,相信有很多码农也都清楚,现在的页游基本上达到饱和,手机上的游戏基本被unity3D与cocos占据,AS基本没有容身之处。so。。。最近我并不打算直接转型
- js跨越获取数据问题记录
haifengwuch
jsonpjsonAjax
js的跨越问题,普通的ajax无法获取服务器返回的值。
第一种解决方案,通过getson,后台配合方式,实现。
Java后台代码:
protected void doPost(HttpServletRequest req, HttpServletResponse resp)
throws ServletException, IOException {
String ca
- 蓝色jQuery导航条
ini
JavaScripthtmljqueryWebhtml5
效果体验:http://keleyi.com/keleyi/phtml/jqtexiao/39.htmHTML文件代码:
<!DOCTYPE html>
<html xmlns="http://www.w3.org/1999/xhtml">
<head>
<title>jQuery鼠标悬停上下滑动导航条 - 柯乐义<
- linux部署jdk,tomcat,mysql
kerryg
jdktomcatlinuxmysql
1、安装java环境jdk:
一般系统都会默认自带的JDK,但是不太好用,都会卸载了,然后重新安装。
1.1)、卸载:
(rpm -qa :查询已经安装哪些软件包;
rmp -q 软件包:查询指定包是否已
- DOMContentLoaded VS onload VS onreadystatechange
mutongwu
jqueryjs
1. DOMContentLoaded 在页面html、script、style加载完毕即可触发,无需等待所有资源(image/iframe)加载完毕。(IE9+)
2. onload是最早支持的事件,要求所有资源加载完毕触发。
3. onreadystatechange 开始在IE引入,后来其它浏览器也有一定的实现。涉及以下 document , applet, embed, fra
- sql批量插入数据
qifeifei
批量插入
hi,
自己在做工程的时候,遇到批量插入数据的数据修复场景。我的思路是在插入前准备一个临时表,临时表的整理就看当时的选择条件了,临时表就是要插入的数据集,最后再批量插入到数据库中。
WITH tempT AS (
SELECT
item_id AS combo_id,
item_id,
now() AS create_date
FROM
a
- log4j打印日志文件 如何实现相对路径到 项目工程下
thinkfreer
Weblog4j应用服务器日志
最近为了实现统计一个网站的访问量,记录用户的登录信息,以方便站长实时了解自己网站的访问情况,选择了Apache 的log4j,但是在选择相对路径那块 卡主了,X度了好多方法(其实大多都是一样的内用,还一个字都不差的),都没有能解决问题,无奈搞了2天终于解决了,与大家分享一下
需求:
用户登录该网站时,把用户的登录名,ip,时间。统计到一个txt文档里,以方便其他系统调用此txt。项目名
- linux下mysql-5.6.23.tar.gz安装与配置
笑我痴狂
mysqllinuxunix
1.卸载系统默认的mysql
[root@localhost ~]# rpm -qa | grep mysql
mysql-libs-5.1.66-2.el6_3.x86_64
mysql-devel-5.1.66-2.el6_3.x86_64
mysql-5.1.66-2.el6_3.x86_64
[root@localhost ~]# rpm -e mysql-libs-5.1
 后台程序说明:
 下面列出的是其他类型图: