char图表
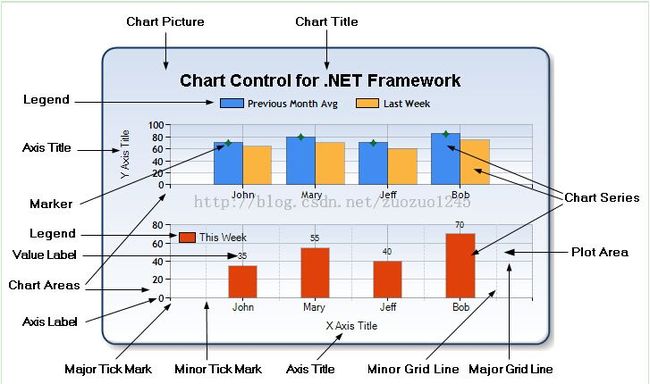
首先看一下chart图表相应的各个属性:
要想使用chart图表,首先须要安装MSChart.exe;安装完后,工具箱里仍然没有,此时要在web.Config文件中加入以下代码:
<span style="font-size:18px;"><span style="font-family:SimSun;"><add tagPrefix="asp" namespace="System.Web.UI.DataVisualization.Charting"
          assembly="System.Web.DataVisualization, Version=4.0.0.0, Culture=neutral, PublicKeyToken=31bf3856ad364e35" />
<add name="ChartImageHandler" preCondition="integratedMode" verb="GET,HEAD,POST"
        path="ChartImg.axd" type="System.Web.UI.DataVisualization.Charting.ChartHttpHandler, System.Web.DataVisualization,</span><span style="font-family:black Verdana, Arial, Helvetica, sans-serif;"> </span><span style="font-family:SimSun;">Version=4.0.0.0, Culture=neutral, PublicKeyToken=31bf3856ad364e35" /></span></span>
最后加入引用System.Web.DataVisualization.dll。
前台代码:
<asp:Chart ID="crtShowMainResult" runat="server" Visible="false" Height="290px" Width="817px" ToolTip="Y轴:分数 X轴:人数">
<span style="white-space:pre">	</span><series>
        <span style="white-space:pre">	</span><asp:Series Name="Series1">
        <span style="white-space:pre">	</span></asp:Series>
        </series>
        <chartareas>
                <asp:ChartArea Name="ChartArea1">
                </asp:ChartArea>
        </chartareas>
</asp:Chart>
后台代码:
<span style="white-space:pre">	</span>    //查询该考试的分数和该分数值的得分人数.
            DataTable dtScoreAndNumInfo = resultBLL.QueryScoreAndNumInfo(hs);
            DataTable mydt = new DataTable();
            mydt.Columns.Add("分数");
            mydt.Columns.Add("人数");
            mydt.Rows.Add();
            mydt.Rows[0]["分数"] = "0~60分";
            mydt.Rows.Add();
            mydt.Rows[1]["分数"] = "60~70分";
            mydt.Rows.Add();
            mydt.Rows[2]["分数"] = "70~80分";
            mydt.Rows.Add();
            mydt.Rows[3]["分数"] = "80~90分";
            mydt.Rows.Add();
            mydt.Rows[4]["分数"] = "90~100分";
            mydt.Rows[0]["人数"] = dtScoreAndNumInfo.Rows[0]["0~60"];
            mydt.Rows[1]["人数"] = dtScoreAndNumInfo.Rows[0]["60~70"];
            mydt.Rows[2]["人数"] = dtScoreAndNumInfo.Rows[0]["70~80"];
            mydt.Rows[3]["人数"] = dtScoreAndNumInfo.Rows[0]["80~90"];
            mydt.Rows[4]["人数"] = dtScoreAndNumInfo.Rows[0]["90~100"];
            //假设记录为空,则提示
            if (dtScoreAndNumInfo.Rows.Count == 0)
            {
                MessageBox.Show(this,"没有记录!");
            }

            //否则赋到图上
            crtShowMainResult.DataSource = mydt;
            //x轴上是分数的值,y轴上是人数的值
            crtShowMainResult.Series["Series1"].XValueMember = "分数";
            crtShowMainResult.Series["Series1"].YValueMembers = "人数";
            //图表将显示每一个数据点的Y值。
            crtShowMainResult.Series["Series1"].IsValueShownAsLabel = true;
            crtShowMainResult.ChartAreas["ChartArea1"].AxisY.Title = "人数(人)";
            crtShowMainResult.Visible = true;
            crtShowMainResult.DataBind();
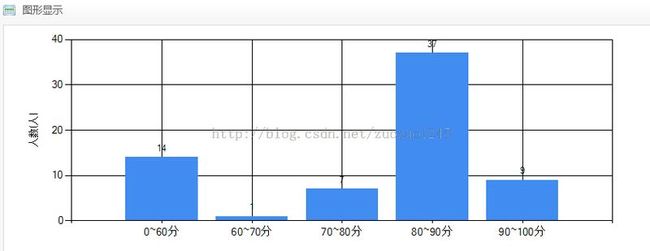
显示结果:

