使用CLR Profiler分析.NET程序
【.NET程序性能分析】使用VS自带的工具分析.NET程序的性能
这篇博文给大家分享的是,如何使用VS自带的性能分析工具来分析我们编写的.NET程序,一边找出程序性能的瓶颈,改善代码的质量。在实际开发中,性能真的很重要,往往决定一个产品的生死~良好的用户体验的基础之一也是程序要有好的性能~
下面以一个大家熟悉比较极端的例子,来说明编写代码时考虑性能的重要性。这里DebugLZQ用的是10.0版本的VS。
示例程序代码如下:
using System;
using System.Collections.Generic;
using System.Linq;
using System.Text;

namespace VS2010性能测试
{
    class Program
    {
        static void Main(string[] args)
        {
            int start = Environment.TickCount;
            for (int i = 0; i < 1000; i++)
            {
                string s = "";
                for (int j = 0; j <200; j++)
                {
                    s += "Outer index = ";
                    s += i;
                    s += " Inner index = ";
                    s += j;
                    s += " ";
                }
            }
            int middle = Environment.TickCount;
            Console.WriteLine("Program part1 run for {0} seconds",0.001 * (middle  - start));
            //
            for (int i = 0; i < 1000; i++)
            {
                StringBuilder s = new StringBuilder();
                for (int j = 0; j <200; j++)
                {
                    s.Append("Outer index = ");
                    s.Append(i);
                    s.Append("Inner index = ");
                    s.Append(j);
                    s.Append(" ");
                }
            }
            int end = Environment.TickCount;
            Console.WriteLine("Program part2 run for {0} seconds", 0.001 * (end - middle));

            //
            Console.ReadKey();
        }
    }
}
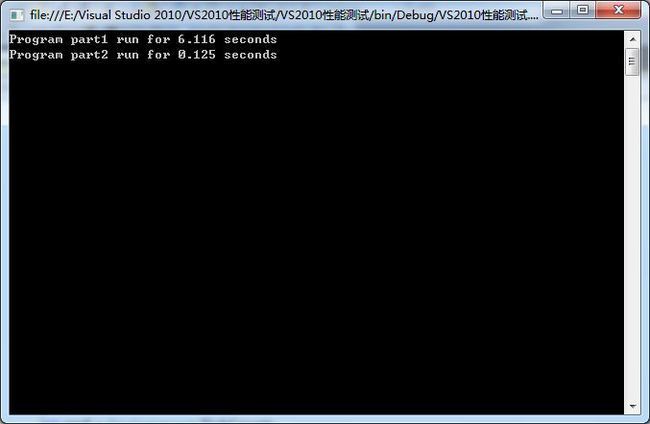
差距就是这么大!
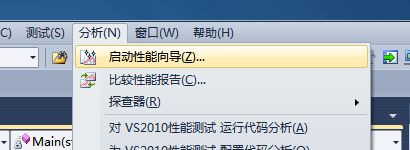
我们可以使用VS自带的性能分析工具来分析这个程序。可以通过“分析”--“启动性能向导”来启动性能分析
我们可以根据需要选择不同的分析方法
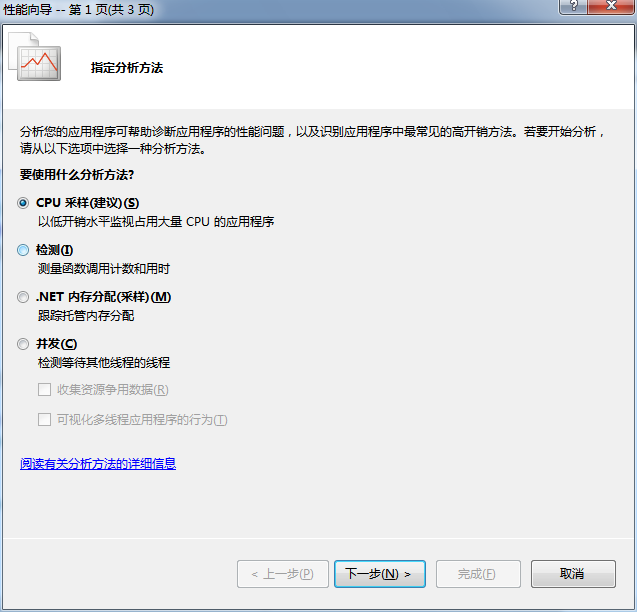
面以“CPU采样”分析为例
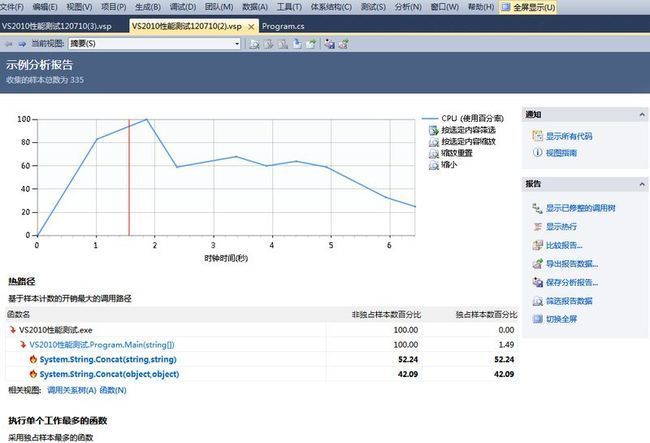
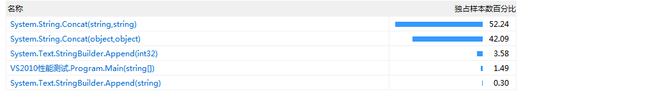
切换到函数视图
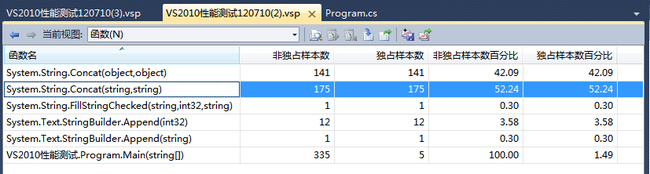
定位到我们的源码:
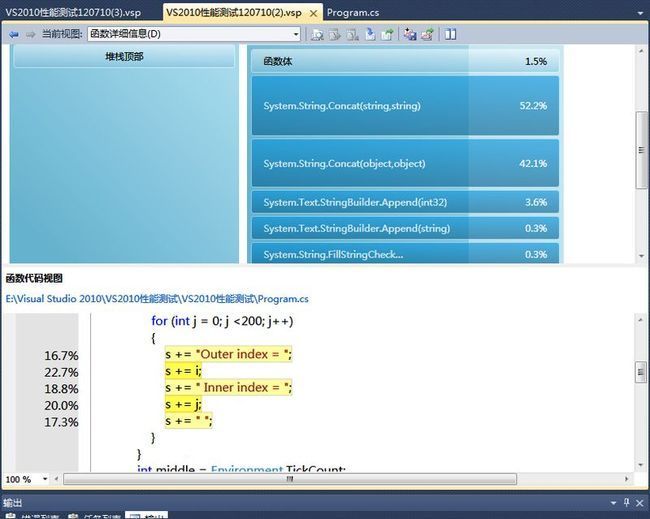
问题找到了~
就像剥去.NET语法糖衣的工具(Reflector等)很多一样,我们可以用来分析.NET程序性能的工具有很多,如前面一片博文DebugLZQ给大家介绍的vs自带的性能分析工具,除此之外常用的还有还有clr profiler、Windbg等。
vs自带的性能分析可以很快的找到瓶颈代码,而且支持多线程。
Windbg就不多说了,Windows平台下强大的用户态和内核态调试工具!虽然windbg也提供图形界面操作,但它最强大的地方还是有着强大的调试命令,用起来比较费劲。
这里主要要说的是CLR Profile了,他检测结果最为详细,不过由于检测托管堆分配和垃圾回收会影响应用程序的运行速度,因此无法得之时间上的性能测试。
CLR Profiler简介
CLR Profiler 是用来观察托管堆内存分配和研究垃圾回收行为的一种工具。使用该工具中不同的视图,你能获得关于你运用程序的执行、内存的分配和消耗等有用信息。CLR Profiler分析的结果存放在日志文件中,常用的几种视图如下:
| View | Description |
|---|---|
| Histogram Allocated Types | Gives you a high-level view of what object types are allocated (by allocation size) during the lifetime of your application. This view also shows those objects that are allocated in the large object heap (objects larger than 85 KB). This view allows you to click parts of the graph so that you can see which methods allocated which objects. |
| Histogram Relocated Types | Displays the objects that the garbage collector has moved because they have survived a garbage collection. |
| Objects By Address | Provides a picture of what is on the managed heap at a given time. |
| Histogram By Age | Allows you to see the lifetime of the objects on the managed heap. |
| Allocation Graph | Graphically displays the call stack for how objects were allocated. You can use this view to: -See the cost of each allocation by method. -Isolate allocations that you were not expecting. -View possible excessive allocations by a method. |
| Assembly, Module, Function, and Class Graph | These four views are very similar. They allow you to see which methods pulled in which assemblies, functions, modules, or classes. |
| Heap Graph | Shows you all of the objects in the managed heap, along with their connections. |
| Call Graph | Lets you see which methods call which other methods and how frequently. You can use this graph to get a feel for the cost of library calls and to determine how many calls are made to methods and which methods are called. |
| Time Line | Displays what the garbage collector does over the lifetime of the application. Use this view to: -Investigate the behavior of the garbage collector. -Determine how many garbage collections occur at the three generations (Generation 0, 1, and 2) and how frequently they occur. -Determine which objects survive garbage collection and are promoted to the next generation. You can select time points or intervals and right-click to show who allocated memory in the interval. |
| Call Tree View | Provides a text-based, chronological, hierarchical view of your application's execution. Use this view to: -See what types are allocated and their size. -See which assemblies are loaded as result of method calls. -Analyze the use of finalizers, including the number of finalizers executed. -Identify methods where Close or Dispose has not been implemented or called, thereby causing a bottleneck. -Analyze allocations that you were not expecting. |
下面还是以前面给出的代码为例,来介绍各种功能。代码如下:
using System;
using System.Collections.Generic;
using System.Linq;
using System.Text;

namespace VS2010性能测试
{
    class Program
    {
        static void Main(string[] args)
        {
            int start = Environment.TickCount;
            for (int i = 0; i < 1000; i++)
            {
                string s = "";
                for (int j = 0; j <200; j++)
                {
                    s += "Outer index = ";
                    s += i;
                    s += " Inner index = ";
                    s += j;
                    s += " ";
                }
            }
            int middle = Environment.TickCount;
            Console.WriteLine("Program part1 run for {0} seconds",0.001 * (middle  - start));
            //
            for (int i = 0; i < 1000; i++)
            {
                StringBuilder s = new StringBuilder();
                for (int j = 0; j <200; j++)
                {
                    s.Append("Outer index = ");
                    s.Append(i);
                    s.Append("Inner index = ");
                    s.Append(j);
                    s.Append(" ");
                }
            }
            int end = Environment.TickCount;
            Console.WriteLine("Program part2 run for {0} seconds", 0.001 * (end - middle));

            //
            Console.ReadKey();
        }
    }
}
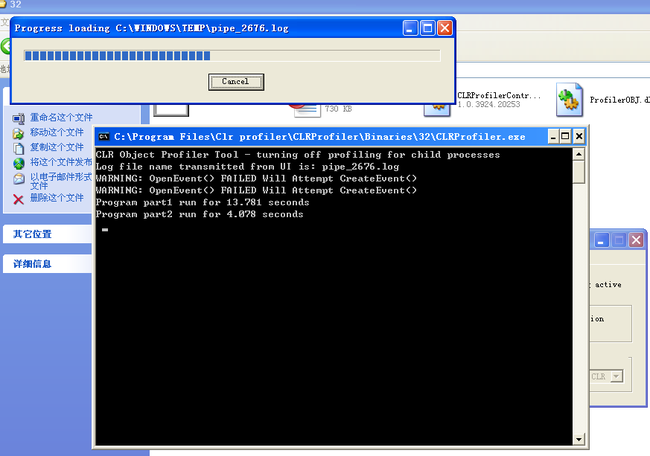
CLR Profiler程序的运行界面如下:
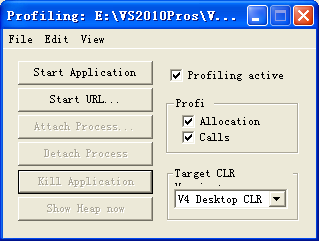
通过start application 选择需要运行的程序,可以选择是否跟踪内存分配和方法调用。当关闭应用程序(可以自动或手动),Profiler自动开始整理结果。分析结果存放在日志文件中,显示如下:
报告统计界面如下:
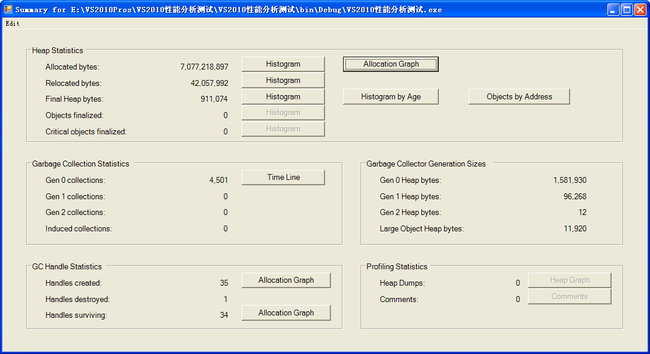
Heap statistics 堆栈统计信息:DebugLZQ的这个测试程序需要分配6.6GB的内存!你有想到过吗?
Allocation Graph:用图表显示堆栈的分配情况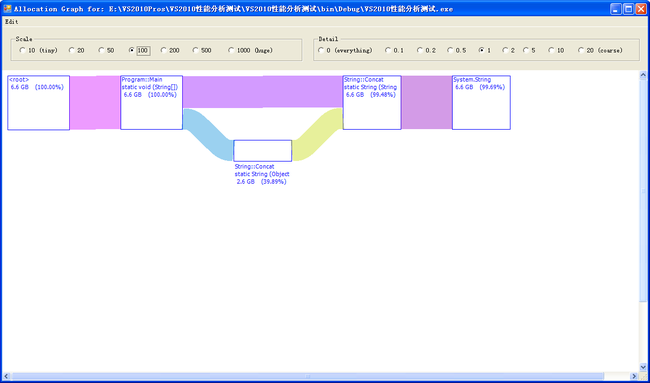
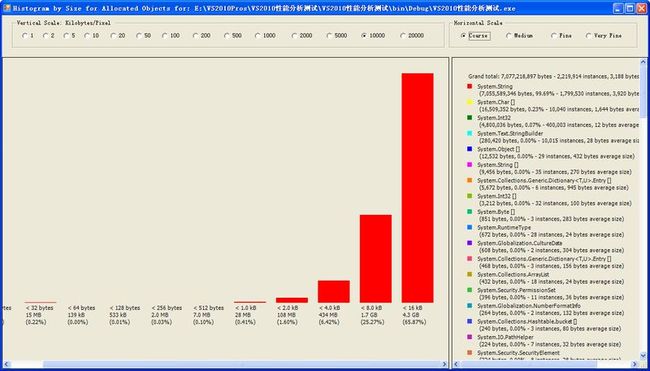
Allocated bytes:应用程序整个启动周期内分配的对象。按照对象大小排列,不同的颜色代码不同的对象,在右侧会列出。以下图为例,红色的是String对象。
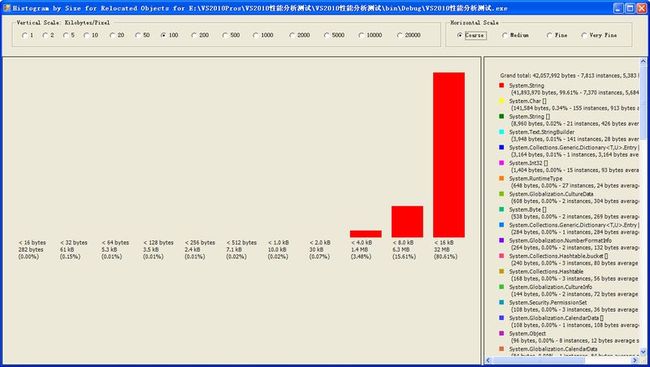
Relocated bytes:GC时被对象在托管堆中的位置被移动过的。不同的颜色代表不同的对象。
(简要介绍下GC过程,大概分两步:有具体算法判断哪些对象成为了垃圾(即根据根引用列表遍历列表引用所指向的对象,不能被遍历的对象);移动堆中的不为垃圾的对象)
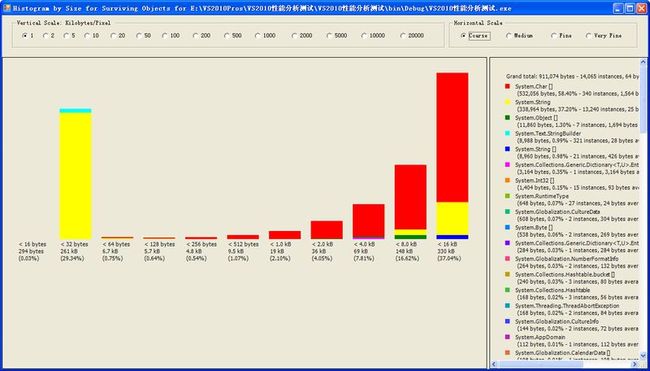
Final Heap bytes:最终还在堆中的。颜色代表种类。
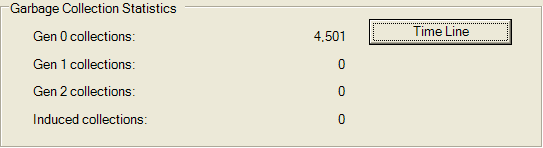
Garbage Collection Statistics :GC统计信息。总共进行了4501次0代垃圾回收!
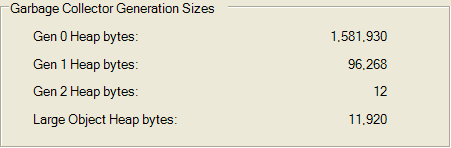
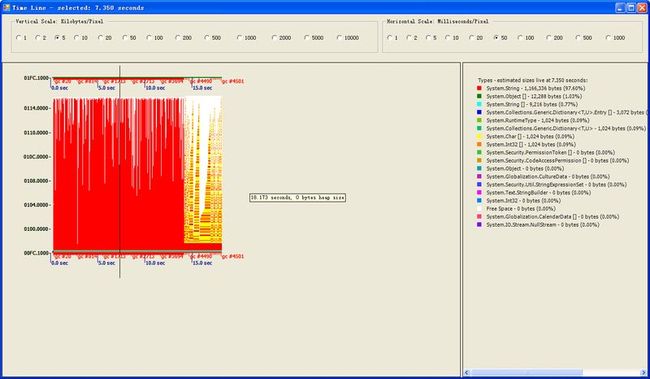
Time视图如下;从图中可以清晰的看出各次回收时间和前后内存占用量(总共4501次)。
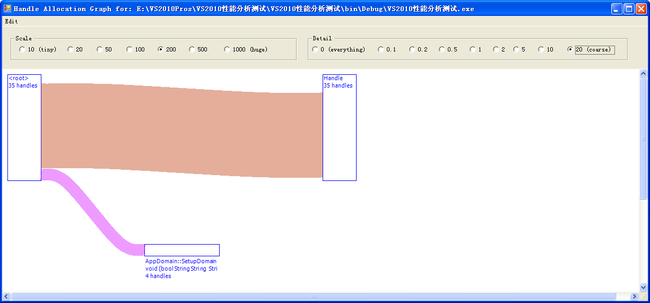
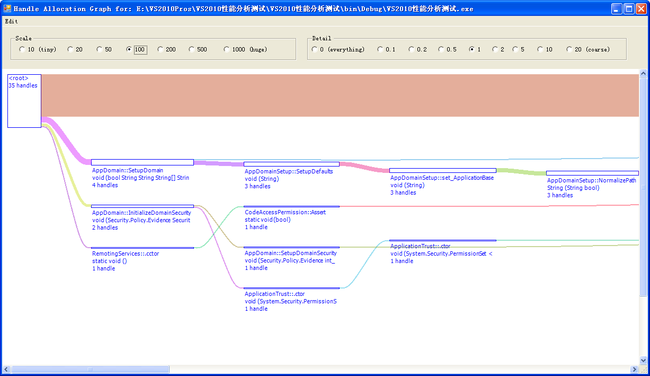
GC Handle: 统计GC句柄数
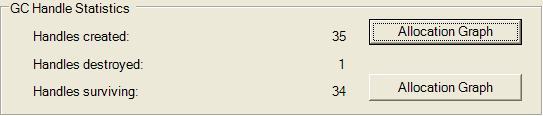
具体细节如下:
就介绍到这里吧。
更为详细的信息,请阅读CLR Profiler 108页的详细说明,这个文档就在你释放出来的文件的根目录下,名称是CLRProfiler.doc。
【希望对你有帮助~请点击下面的“绿色通道”---“关注DebugLZQ”,共同交流进步~】