1)首先引入必须的css和js文件
<link href="<%=contextPath %>/lib/jqplot/jquery.jqplot.css" rel="stylesheet" type="text/css" />
<script type="text/javascript" src="<%=contextPath %>/lib/jqplot/jquery.min.js"></script>
<script type="text/javascript" src="<%=contextPath %>/lib/jqplot/jquery.jqplot.min.js"></script>
<script type="text/javascript" src="<%=contextPath %>/lib/jqplot/plugins/jqplot.pieRenderer.min.js"></script>
<script type="text/javascript" src="<%=contextPath %>/lib/jqplot/plugins/jqplot.logAxisRenderer.min.js"></script>
<script type="text/javascript" src="<%=contextPath %>/lib/jqplot/plugins/jqplot.canvasTextRenderer.min.js"></script>
<script type="text/javascript" src="<%=contextPath %>/lib/jqplot/plugins/jqplot.categoryAxisRenderer.min.js"></script>
<script type="text/javascript" src="<%=contextPath %>/lib/jqplot/plugins/jqplot.canvasAxisTickRenderer.min.js"></script>
<script type="text/javascript" src="<%=contextPath %>/lib/jqplot/plugins/jqplot.dateAxisRenderer.min.js"></script>
<script type="text/javascript" src="<%=contextPath %>/lib/jqplot/plugins/jqplot.barRenderer.min.js"></script>
<script type="text/javascript" src="<%=contextPath %>/lib/jqplot/plugins/jqplot.enhancedLegendRenderer.min.js"></script>
<script type="text/javascript" src="<%=contextPath %>/lib/jqplot/plugins/jqplot.highlighter.min.js"></script>
<script type="text/javascript" src="<%=contextPath %>/lib/jqplot/plugins/jqplot.pointLabels.min.js"></script>
<script type="text/javascript" src="<%=contextPath %>/lib/jqplot/plugins/jqplot.cursor.min.js"></script>
<script type="text/javascript" src="<%=contextPath %>/lib/jqplot/plugins/jqplot.dragable.min.js"></script>
2)在<body>上先定义一个div容器
<body>
   <div id="chartContainer"/>
</body>
3)折线图(简单配置)
var date = [['2014-07-01',1],['2014-07-02',2],['2014-07-03',3],['2014-07-04',4],['2014-07-05',5],['2014-07-06',6],['2014-07-07',7]];
$.jqplot('chartContainer', [date], {
	//标题
	title : '最近七天订单销售金额',
	//线(默认配置)
	seriesDefaults : {
        rendererOptions : {
            animation: {
                show: true
            }
        }
    },
  	//轴 (默认配置)
	axesDefaults: {
		tickRenderer : jQuery.jqplot.CanvasAxisTickRenderer,
		pad : 1.2
    },
    //轴(具体配置)
	axes : {
		xaxis : { //设置X轴
			label : '销售时间',
			renderer : $.jqplot.DateAxisRenderer,
		 	tickOptions : {
            	angle : 0,
            	formatString: '%Y-%m-%d'
            }
		},
		yaxis : { //设置Y轴
			label : '销售金额'
		}
	},
	//数据点提示框
	highlighter : {
        show : true,
        tooltipContentEditor : function(xydata, seriesIndex, pointIndex, plot) {
            return '<span style="font-size:15px;">' +  xydata + '</span>';
        }
    }
});
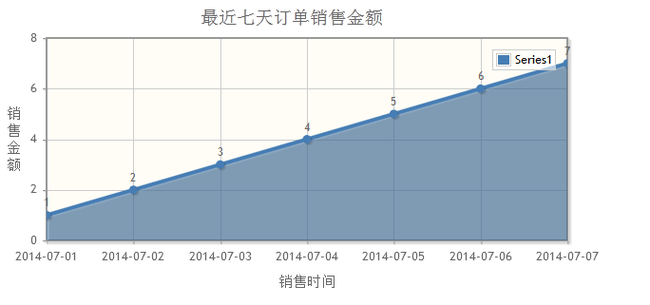
4)折线图(复杂配置)
//构造数据
var date = [['2014-07-01',1],['2014-07-02',2],['2014-07-03',3],['2014-07-04',4],['2014-07-05',5],['2014-07-06',6],['2014-07-07',7]];
//构造chart
$.jqplot('Near7DaysOrdersMoneyChart', [date], {
	//标题
	title : '最近七天订单销售金额',
	//线(默认配置)
	seriesDefaults : {
		show: true,
		showLine: true,
		showMarker: true,
		fill : true, //填充折线以下的面积
		fillAndStroke: true, //在fill为true的状态下,在填充区域最上面显示一条线(如果是折线图则显示该折线)
		fillColor: '#467DB4',   // 设置填充区域的颜色
                fillAlpha: 0.5,  // 梃置填充区域的透明度
		shadow: true,
		shadowAngle: 45,
        shadowOffset: 1.25,
        shadowDepth: 3,
        shadowAlpha: 0.1,
        lineWidth: 4,
        rendererOptions : {
            animation: {
                show: true
            }
        },
        //在数据点上展示值
        pointLabels : {
            show : true
        },
        markerRenderer: $.jqplot.MarkerRenderer,
        //数据点配置
        markerOptions: {
            color: '#467DB4',    // 数据点的颜色
        }
    },
    //线(具体配置)
    series : [{
    	color : '#467DB4'
    }],
  	//轴 (默认配置)
	axesDefaults: {
		tickRenderer : jQuery.jqplot.CanvasAxisTickRenderer,
		pad : 1.2
    },
    //轴(具体配置)
	axes : {
		xaxis : { //设置X轴
			label : '销售时间',
			renderer : $.jqplot.DateAxisRenderer,
		 	tickOptions : {
            	angle : 0,
            	formatString: '%Y-%m-%d'
            }
		},
		yaxis : { //设置Y轴
			label : '销售金额'
		}
	},
	//分类框
	legend : {
        renderer : jQuery.jqplot.EnhancedLegendRenderer,
        show : true,
        location : 'ne',
        placement : 'inside',
        fontSize : '12px',
        rowSpacing : '1px',
        labels : ['Series1']
    },
	//数据点提示框
	highlighter : {
        show : true,
        tooltipContentEditor : function(xydata, seriesIndex, pointIndex, plot) {
            return '<span style="font-size:15px;">' +  xydata + '</span>';
        }
    }
});
效果图
