ext linechart 成功案例
<!DOCTYPE html PUBLIC "-//W3C//DTD XHTML 1.0 Transitional//EN" "http://www.w3.org/TR/xhtml1/DTD/xhtml1-transitional.dtd">
<html xmlns="http://www.w3.org/1999/xhtml">
<head>
<title></title>
<meta http-equiv="content-type" content="text/html; charset=UTF-8"/>
<link rel="stylesheet" type="text/css" href="../../ext/resources/css/ext-all.css" />
<script type="text/javascript" src="../../ext/adapter/ext/ext-base.js" ></script>
<script type="text/javascript" src="../../ext/ext-all.js" ></script>
<script src="../../ext/ext-lang-zh_CN.js" type="text/javascript"></script>
<!-- 如需使用Ext.example.msg()需 引入下面js-->
<script src="../../ext/shared/examples.js" type="text/javascript"></script>
<script type="text/javascript">
Ext.chart.Chart.CHART_URL = '../../ext/resources/charts.swf';
Ext.onReady(function(){
var store = new Ext.data.JsonStore({
fields:['name', 'visits', 'views'],
data: [
{name:'Jul 07', visits: 245000, views: 3000000},
{name:'Aug 07', visits: 240000, views: 3500000},
{name:'Sep 07', visits: 355000, views: 4000000},
{name:'Oct 07', visits: 375000, views: 4200000},
{name:'Nov 07', visits: 490000, views: 4500000},
{name:'Dec 07', visits: 495000, views: 5800000},
{name:'Jan 08', visits: 520000, views: 6000000},
{name:'Feb 08', visits: 620000, views: 7500000}
]
});
new Ext.Panel({
title: '趋势图',
applyTo: 'container',
width:900,
height:500,
layout:'fit',
items:{
xtype: 'linechart',
store: store,
xField: 'name',
listeners: {
itemclick: function(o){
var rec = store.getAt(o.index);
Ext.example.msg('提示', '你点击了 {0}.', rec.get('name'));
}},
chartStyle : {
animationEnabled : true,
legend : {
display : "bottom", spacing : 2,
padding : 5,
font : {
name : 'Tahoma', color : '#3366FF',
size : 12, bold : true
}
}},
series: [{
type: 'line',displayName: 'Views',
yField: 'views', style: {color:0x99BBE8}
},{
type:'line',displayName: 'Visits',
yField: 'visits', style: {color: 0x15428B}
}]
}
});
});
</script>
</head>
<body>
<div id ="container"></div>
</body>
</html>
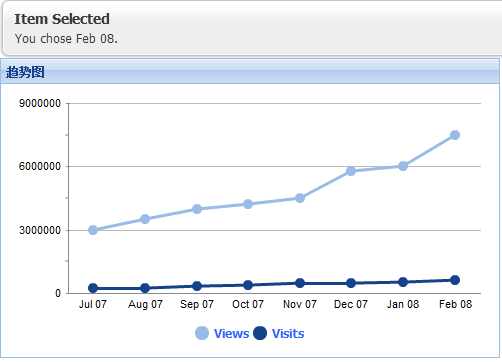
演示结果图形:

部分说明:

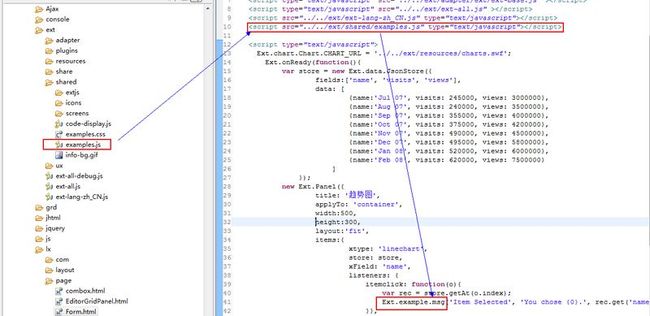
代码中如果要使用Ext.example.msg。需引入examples.js,如上,
也可使用:Ext.Msg.alert(‘’,'');达到相同效果
有问题咨询QQ:1746773660
<html xmlns="http://www.w3.org/1999/xhtml">
<head>
<title></title>
<meta http-equiv="content-type" content="text/html; charset=UTF-8"/>
<link rel="stylesheet" type="text/css" href="../../ext/resources/css/ext-all.css" />
<script type="text/javascript" src="../../ext/adapter/ext/ext-base.js" ></script>
<script type="text/javascript" src="../../ext/ext-all.js" ></script>
<script src="../../ext/ext-lang-zh_CN.js" type="text/javascript"></script>
<!-- 如需使用Ext.example.msg()需 引入下面js-->
<script src="../../ext/shared/examples.js" type="text/javascript"></script>
<script type="text/javascript">
Ext.chart.Chart.CHART_URL = '../../ext/resources/charts.swf';
Ext.onReady(function(){
var store = new Ext.data.JsonStore({
fields:['name', 'visits', 'views'],
data: [
{name:'Jul 07', visits: 245000, views: 3000000},
{name:'Aug 07', visits: 240000, views: 3500000},
{name:'Sep 07', visits: 355000, views: 4000000},
{name:'Oct 07', visits: 375000, views: 4200000},
{name:'Nov 07', visits: 490000, views: 4500000},
{name:'Dec 07', visits: 495000, views: 5800000},
{name:'Jan 08', visits: 520000, views: 6000000},
{name:'Feb 08', visits: 620000, views: 7500000}
]
});
new Ext.Panel({
title: '趋势图',
applyTo: 'container',
width:900,
height:500,
layout:'fit',
items:{
xtype: 'linechart',
store: store,
xField: 'name',
listeners: {
itemclick: function(o){
var rec = store.getAt(o.index);
Ext.example.msg('提示', '你点击了 {0}.', rec.get('name'));
}},
chartStyle : {
animationEnabled : true,
legend : {
display : "bottom", spacing : 2,
padding : 5,
font : {
name : 'Tahoma', color : '#3366FF',
size : 12, bold : true
}
}},
series: [{
type: 'line',displayName: 'Views',
yField: 'views', style: {color:0x99BBE8}
},{
type:'line',displayName: 'Visits',
yField: 'visits', style: {color: 0x15428B}
}]
}
});
});
</script>
</head>
<body>
<div id ="container"></div>
</body>
</html>
演示结果图形:

部分说明:

代码中如果要使用Ext.example.msg。需引入examples.js,如上,
也可使用:Ext.Msg.alert(‘’,'');达到相同效果
有问题咨询QQ:1746773660