jfreeChar线状图
import java.awt.Color;
import java.awt.Font;
import java.io.File;
import java.io.FileNotFoundException;
import java.io.FileOutputStream;
import java.io.IOException;
import org.jfree.chart.ChartFactory;
import org.jfree.chart.ChartFrame;
import org.jfree.chart.ChartUtilities;
import org.jfree.chart.JFreeChart;
import org.jfree.chart.axis.CategoryAxis;
import org.jfree.chart.axis.ValueAxis;
import org.jfree.chart.plot.CategoryPlot;
import org.jfree.chart.plot.PlotOrientation;
import org.jfree.chart.title.TextTitle;
import org.jfree.data.category.DefaultCategoryDataset;
public class CreateLineChart {
private static JFreeChart chart;
private static DefaultCategoryDataset dataset;
/**
* @param args
*/
public static void main(String[] args) {
// TODO Auto-generated method stub
//步骤1:创建XYDataset对象(准备数据)
createDataset();
//步骤2:根据Dataset 生成JFreeChart对象,以及做相应的设置
createChart();
//步骤3:将JFreeChart对象输出到文件,Servlet输出流等
saveAsFile(chart, "D:\\lineXY.png", 600, 400);
//显示
ChartFrame frame = new ChartFrame("BarChart Tesing!", chart);
frame.pack();
frame.setVisible(true);
}
/**
* Create DataSet
*/
private static void createDataset() {
dataset = new DefaultCategoryDataset();
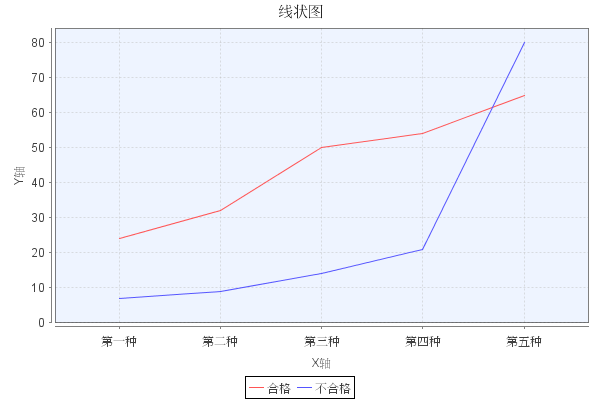
double[][] data = new double[][] {{24, 32, 50, 54, 65},{7, 9, 14, 21, 80}};
String[] rowKeys = {"合格","不合格"};
String[] columnKeys = {"第一种","第二种","第三种","第四种","第五种"};
for (int i = 0; i < rowKeys.length; i++) {
for (int j = 0; j < columnKeys.length; j++) {
dataset.setValue(data[i][j], rowKeys[i], columnKeys[j]);
}
}
}
public static void createChart() {
chart = ChartFactory.createLineChart("线状图", // 图表标题
"X轴", // 目录轴的显示标签
"Y轴", // 数值轴的显示标签
dataset, // 数据集
PlotOrientation.VERTICAL, // 图表方向:水平、垂直
true, // 是否显示图例(对于简单的柱状图必须是false)
true, // 是否生成工具
false); // 是否生成URL链接
CategoryPlot plot = chart.getCategoryPlot();
plot.setBackgroundPaint(new Color(238, 244, 255));//设置图表的颜色
plot.setDomainGridlinePaint(Color.lightGray);//设置垂直网格线的颜色
plot.setRangeGridlinePaint(Color.lightGray);//设置水平网格线的颜色
plot.setDomainGridlinesVisible(true); //设置垂直网格线是否显示
plot.setRangeGridlinesVisible(true); //设置水平网格线是否显示
chart.setBackgroundPaint(Color.white);
setChartFont();
}
/**
* Save chart to File
* @param chart
* @param outputPath
* @param weight
* @param height
*/
public static void saveAsFile(JFreeChart chart, String outputPath,
int weight, int height) {
FileOutputStream out = null;
try {
File outFile = new File(outputPath);
if (!outFile.getParentFile().exists()) {
outFile.getParentFile().mkdirs();
}
out = new FileOutputStream(outputPath);
//保存为PNG
ChartUtilities.writeChartAsPNG(out, chart, weight, height);
// 保存为JPEG
// ChartUtilities.writeChartAsJPEG(out, chart, weight, height);
out.flush();
} catch (FileNotFoundException e) {
e.printStackTrace();
} catch (IOException e) {
e.printStackTrace();
} finally {
if (out != null) {
try {
out.close();
} catch (IOException e) {
// do nothing
}
}
}
}
/**
* 图标乱码解决
*/
private static void setChartFont() {
Font title = new Font("楷体", Font.PLAIN, 15);
Font f = new Font("楷体", Font.PLAIN, 12);
//title(标题),
TextTitle textTitle = chart.getTitle();
textTitle.setFont(title);
CategoryPlot plot = chart.getCategoryPlot();
CategoryAxis domainAxis = plot.getDomainAxis();
//设置X轴坐标上的文字
domainAxis.setTickLabelFont(f);
//设置X轴的标题文字
domainAxis.setLabelFont(f);
ValueAxis numberaxis = plot.getRangeAxis();
//设置Y轴坐标上的文字
numberaxis.setTickLabelFont(f);
//设置Y轴的标题文字
numberaxis.setLabelFont(f);
chart.getLegend().setItemFont(f);
}
}
运行得到的图片: