Sample Data
1,101,5.0
1,102,3.0
1,103,2.5
2,101,2.0
2,102,2.5
2,103,5.0
2,104,2.0
3,101,2.5
3,104,4.0
3,105,4.5
3,107,5.0
4,101,5.0
4,103,3.0
4,104,4.5
4,106,4.0
5,101,4.0
5,102,3.0
5,103,2.0
5,104,4.0
5,105,3.5
5,106,4.0
-
Pearson correlation–based similarity
The Pearson correlation(Pearson Product Moment Correlation) is a number between –1 and 1 that measures the tendency of two series of numbers, paired up one-to-one, to move together. That is to say, it measures how likely a number in one series is to be relatively large when the corresponding number in the other series is high, and vice versa. It measures the tendency of the numbers to move together proportionally, such that there’s a roughly linear relationship between the values in one series and the other. When this tendency is high,the correlation is close to 1. When there appears to be little relationship at all, the value is near 0. When there appears to be an opposing relationship—one series’ numbers are high exactly when the other series’ numbers are low—the value is near –1.
It measures the tendency of two users’ preference values to move together—to be relatively high, or relatively low, on the same items.
Formula
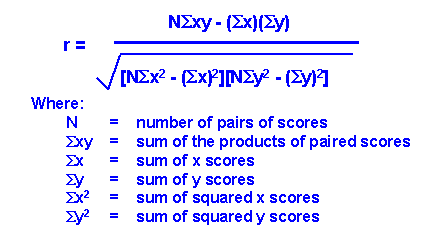
The similarity computation can only operate on items that both users have expressed a preference for.
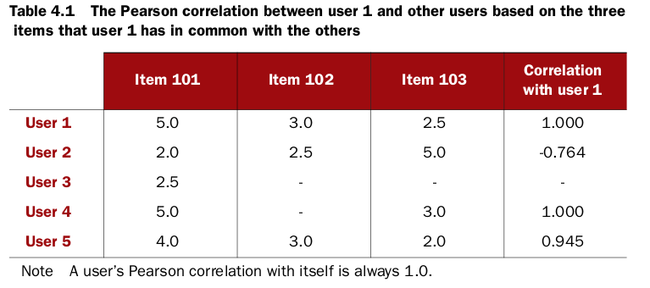
Pearson correlation problems
First, it doesn’t take into account the number of items in which two users’ preferences overlap, which is probably a weakness in the context of recommender engines.
Second, if two users overlap on only one item, no correlation can be computed because of how the computation is defined.
Finally, the correlation is also undefined if either series of preference values are all
identical.
Class Constructor
PearsonCorrelationSimilarity(DataModel dataModel)
PearsonCorrelationSimilarity(DataModel dataModel, Weighting weighting)
-
Euclidean distance based similarity
This implementation is based on the distance between users. This idea makes sense if you think of users as points in a space of many dimensions (as many dimensions as there are items), whose coordinates are preference values.
Formula
r=1/(1+d)

Class Constructor
EuclideanDistanceSimilarity(DataModel dataModel)
EuclideanDistanceSimilarity(DataModel dataModel, Weighting weighting)
-
cosine measure similarity
The cosine measure similarity is another similarity metric that depends on envisioning user preferences as points in space. Hold in mind the image of user preferences as points in an n-dimensional space. Now imagine two lines from the origin, or point (0,0,...,0), to each of these two points. When two users are similar, they’ll have similar ratings, and so will be relatively close in space—at least, they’ll be in roughly the same direction from the origin. The angle formed between these two lines will be relatively small. In contrast, when the two users are dissimilar, their points will be distant, and likely in different directions from the origin, forming a wide angle.
Formula

Class Constructor
PearsonCorrelationSimilarity(DataModel dataModel)
PearsonCorrelationSimilarity(DataModel dataModel, Weighting weighting)
-
Spearman correlation based similarity
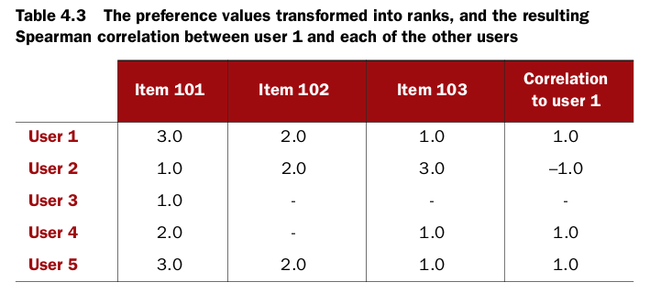
The Spearman correlation is an interesting variant on the Pearson correlation, for our purposes. Rather than compute a correlation based on the original preference values, it computes a correlation based on the relative rank of preference values. Imagine that, for each user, their least-preferred item’s preference value is overwritten with a 1. Then the next-least-preferred item’s preference value is changed to 2, and so on. To illustrate this, imagine that you were rating movies and gave your least-preferred movie one star, the next-least favorite two stars, and so on. Then, a Pearson correlation is computed on the transformed values.
Class Constructor
SpearmanCorrelationSimilarity(DataModel dataModel)
Note:The Spearman correlation–based similarity metric is expensive to compute, and is therefore possibly more of academic interest than practical use.
CachingUserSimilarity
It is a UserSimilarity implementation that wraps another UserSimilarity implementation and caches its results. That is, it delegates computation to another, given implementation, and remembers those
results internally. Later, when it’s asked for a user-user similarity value that was previously computed, it can answer immediately rather than ask the given implementation to compute it again. In this way, you can add caching to any similarity implementation. When the cost of performing a computation is relatively high, as here, it can be worthwhile to employ. The cost, of course, is the memory consumed by the cache.
UserSimilarity similarity
      = new CachingUserSimilarity(new SpearmanCorrelationSimilarity(model), model);
-
Ignoring preference values in similarity with the Tanimoto coefficient
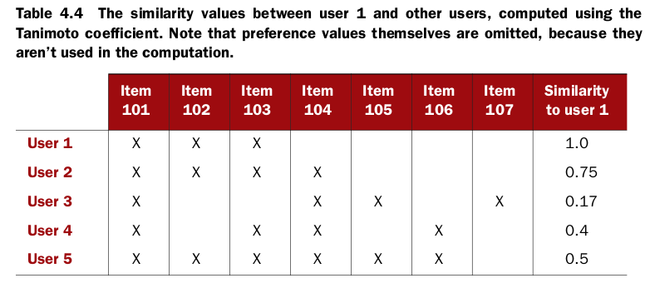
The algorithm doesn’t care whether a user expresses a high or low preference for an item—only that the user expresses a preference at all.
Formula
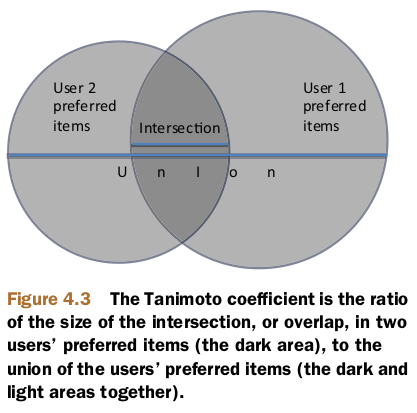 In other words, it’s the ratio of the size of the intersection to the size of the union of their preferred items.Note that this similarity metric doesn’t depend only on the items that both users have some preference for, but that either user has some preference for. Hence, all seven items appear in the calculation, unlike before.
 Class Constructor
TanimotoCoefficientSimilarity(DataModel dataModel)
-
Log-likelihood–based similarity
It is similar to the Tanimoto coefficient–based similarity, though it’s more difficult to understand intuitively. It’s another metric that doesn’t take account of individual preference values. Like the Tanimoto coeffi-
cient, it’s based on the number of items in common between two users, but its value is more an expression of how unlikely it is for two users to have so much overlap, given the total number of items out there and the number of items each user has a preference for.
With some statistical tests, this similarity metric attempts to determine just how strongly unlikely it is
that two users have no resemblance in their tastes; the more unlikely, the more similar the two should be. The resulting similarity value may be interpreted as a probability that the overlap isn’t due to chance.


Class Constructor
LogLikelihoodSimilarity(DataModel dataModel)
References
http://www.statisticshowto.com/what-is-the-pearson-correlation-coefficient/
http://www.socialresearchmethods.net/kb/statcorr.php
http://en.wikipedia.org/wiki/Cosine_similarity
Books


