一个PHP图表绘制类 - Chart
Chart是一个使用PHP写的图表类,调用GD库来进行画图操作,最后维护时间是2004年,通用性不一定很强,但是绘制图表功能还不错,可以绘制自己需要一些简单的图表。
下载地址:http://quimby.gnus.org/circus/chart/chart-0.8.tar.gz
手册:http://quimby.gnus.org/circus/chart/chart-manual.php
Chart Manual
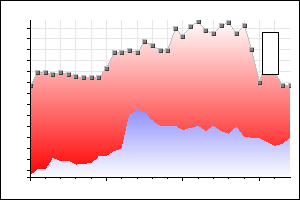
Chart is a PHP4 library for generating charts--two dimensional representations of data sets. This is the manual for Chart 0.8.
Chart is covered by the GNU GPL and is written by Lars Magne Ingebrigtsen. Development of this library was paid for by Net Fonds ASA.
Download
A tarred and gzipped package of the latest version of the library.
A super-quick example
Before getting down to the business at hand, let's just have a look at a quick example of what Chart is meant to do, and how it does it.
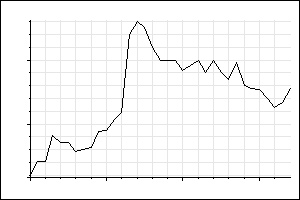
The simplest Chart program imaginable is the one that generated the image to the right. The source code is the following: 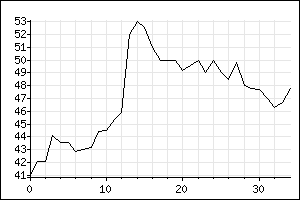
$chart = new chart(300, 200);$chart->plot($data);$chart->stroke();
This demonstrates the following:
- Chart is a class
- You create a new chart, and then do stuff with it until you stroke it
- Scaling is done automatically by default
- Grids and ticks are computed in a more-or-less sensible way by default
After that mini-introduction, the manual will now continue as scheduled:
Rationale
I work for an Internet stock broker, and we needed to allow users to generate charts from our web pages. One smart way to do that would be to create Java applets and push the computation out to the clients, but there are some problems with that (stability, usability and the difficulty when printing them out -- the latter is very important in financial circles). So we wanted to generate the graphs on the web servers, and just serve them out as images.
The rest of our web site is PHP-based, so it was natural to want to use PHP for generating the graphs. One less thing that can go wrong is one less thing that can go wrong.
As an olden gnuplot user, my first impulse was to create something that resembled that, but I quickly realized that my hubris wasn't that overwhelming -- yet. Gnuplot is an excellent, flexible, complex program, but its functionality is overkill for what I need. I do not need to plot three-dimensional data sets using esoteric functions. I have actual two-dimensional (or de facto two-dimensional) data sets that I wish to have presented graphically. Chart attempts to fill that (much simpler) need.
I have tried to emphasize ease of use -- Chart usually computes all the boring stuff itself. However, most everything that Chart does can be overridden or customized if you want a different look.
About the examples
All the example charts are, of course, generated by Chart. The data sets for the charts come from a static data file, but normally one would get the data sets from a data base or something similar.
The actual source code for all the charts can be read by clicking on the charts.
PHP4
Chart needs PHP4. PHP3 has a much too weak object model to allow working with a non-trivial set of objects in a sensible manner. PHP4 can be gotten from the PHP web site. The only non-standard library Chart relies on is RGB, which makes it much easier to deal with colors. RGB is included in the Chart package.
Function reference
There are two classes in the Chart library -- chart and plot. Each chart can contain any number of plots. 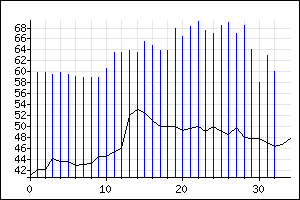
Here's a chart with two plots:
Chart Functions
chart
chart(int $width, int $height, string $cache = false)
Create a chart object of the specified size. If the optional $cache parameter is supplied, the cache is maintained.
set_border
set_border(color $color = "black", int $width = 1)
Draw a border around the chart using the specified color and width. If you specify false as the color, no border will be drawn. 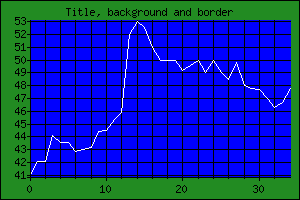
set_background_color
set_background_color (color $color = "white", color $surround = "white")
Sets the background color of the chart. The "surrounding" color is the color of the area between the chart itself and the outer border.
set_x_ticks
set_x_ticks (array $ticks, $format = "date")
Specify where the X axis tick texts are supposed to come from. They will be formatted according to the input format specified. The following input formats are supported:
- "date": The date in ISO 8601 format.
- "time": The time in ISO 8601 format.
- "cdate": The date in Unix format.
- "ctime": The time in Unix format.
- "text": Simple text.
ISO 8601 format looks like YYYYMMDDThhmmss. Unix time format is the number of seconds since January 1st 1970.
set_title
set_title (string $title, color $color = "black", string $where = "center")
Set the title of the chart. The positioning parameter can be "center", "left" or "right", or an array with two elements -- the X and Y position of the left- and topmost pixel of the title.
set_axes
set_axes (string $which = "xy", color $color = "black")
Specify which axes to draw, and the color of the axes. You can have "y", "x" or "xy" axes drawn.
splot
splot (plot &$plot)
Adds plot $plot to the chart. Here's a code snippet to illustrate:
$chart = new chart(100, 200);$plot = new plot($data);$chart->splot(&$plot);
You'd normally not use this function, but use the plot() function instead.
plot
plot (array $c1, array $c2 = false, color $color = "black", string $style = "lines", color $gradient_color = "black", int $parameter = 0)
Register either a one-dimensional data set or (if $c2 is an array) a two-dimensional data set to be plotted. Both arrays must be one-dimensional. This function returns a plot object. See set_style() for a listing of possible styles.
stroke
stroke (function $callback = false)
This is the function that does all the work. None of the other functions actually compute anything -- they just register things. This function looks at everything that has been registered, computes everything, outputs the proper HTTP headers and outputs the resulting image (in GIF format).
If the plot needs special handling, you can supply a call-back function. Then stroke will compute everything, do the grid and the axes (etc.), and then call the call-back function with the following signature:
$callback($image, $xmin, $xmax, $ymin, $ymax, $xoffset, $yoffset, $width, $height);
Then it is up to the call-back function to draw the data set. 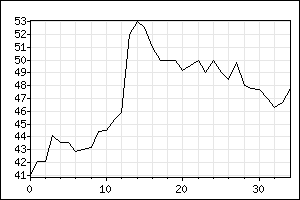
set_frame
set_frame ($frame = true)
Draw a frame around the plotted area, using the same color as the border.
set_expired
set_expired (bool $expired)
If the images you generate are truly dynamic, then you probably want to prohibit the web browser and any proxies/caches from storing the images. Calling this function with a non-false value will make Chart output headers to discourage caching on the client side. Note that this will probably result in much higher traffic. 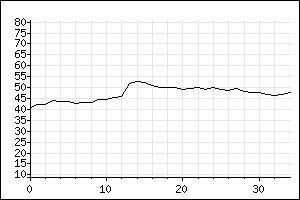
set_extrema
set_extrema (int $y_min = false, int $y_max = false, int $x_min = false, int $x_max = false)
By default, scaling is done automatically. Chart computes all the extrema and adds 1% fudge space. If you want to manually set the extrema (for instance, if you're generating several charts and want to keep the same scaling on all the charts), you can use this function to specify the extrema.
For instance, the image to the right uses the same data as the one above, but has the Y extrema set much wider than the default algorithm would have done.
set_grid_color
set_grid_color (Color $color)
Set the color of the grid.
set_margins
set_margins (int $left = 30, int $right = 10, int $top = 20, int $bottom = 23)
Set the width of the margins.
set_tick_distance
set_tick_distance (int $distance)
Set the distance (in pixels) between the ticks on the axes. 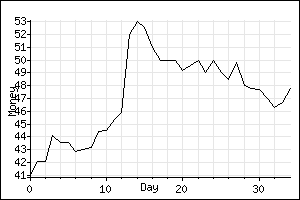
set_labels
set_labels (string $x = false, string $y = false)
Set the X and Y labels of the chart.
set_output_size
set_output_size (int $width, int $height)
Set the output size to something else than the size you create the chart at. This can be useful if you want to create a very small chart, and want to plot it at a bigger size, and then resize it down to a small size, so that you can get antialiased resampling. This only works if you have PHP compiled with the 2.0 version of the gd library (and set the $gd2 variable to true). If not, the resizing will be very, very ugly.
set_grid_color
set_grid_color (color $grid_color, bool $grid_under_plot = true)
Set the color of the grid. Optionally say whether the grid should be under the data plot (which is the default), or over it (which is useful if plotting using the "fill" or "gradient" plot styles. 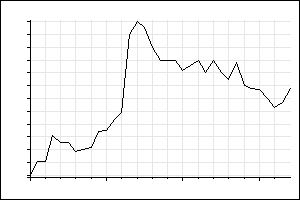
set_font
set_font ($font, $type, $size = false)
Set the font used for the title and labels. Three font types can be used:
- "internal": The internal PHP fonts. The $font parameter should be an integer between 0 and 8.
- "type1": A type1 PS font. The $font parameter should be the path to a file containing the PFB font file for the type1 font. To use this, your PHP has to be compiled with support for type1 fonts. (I.e., the t1lib library has to be compiled in.)
- "ttf": A TrueType PS font. The $font parameter should be the path to a file containing the TTF font file for the ttf font. To use this, your PHP has to be compiled with support for TTF fonts. (I.e., the freetype library has to be compiled in.)
Most Unixoid people will want to use Type1 fonts, as these are included in all TeX distributions. Just say something like
$chart->set_font("/usr/share/texmf/fonts/type1/adobe/utopia/putb8a.pfb", "type1");
If you specify the optional $size parameter, the font will be scaled using that point size. The parameter has no effect for internal fonts.
Using Type1 or TTF fonts will make Chart a lot slower. Caching is an absolute must is you don't use the internal fonts. 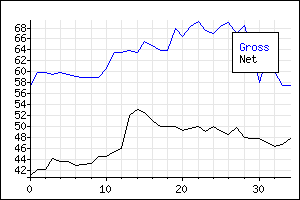
add_legend
add_legend ($string, $color)
Add a legend to the chart. The following variables can be set to tune the legend:
- $legend_background_color: The background color of the legend. If set to false, the background of the legend will be transparent.
- $legend_border_color: The border color of the legend. If set to false, no border will be drawn.
- $legend_margin: The size of the margin, in pixels, between the legend text and the legend border.
Plot Functions
set_color
set_color (color $color)
set_style ($style)
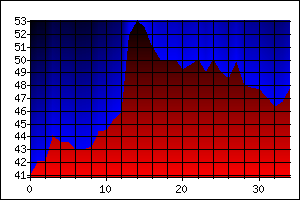
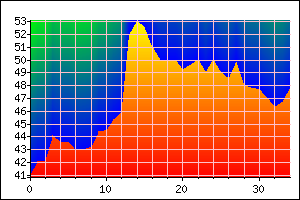
Set the style of the plot. Valid values are "lines", "points", "impulse", "circle", "cross", "fill", "square", "triangle" , "box" and "gradient".
- "lines": Draw angled lines between data points.
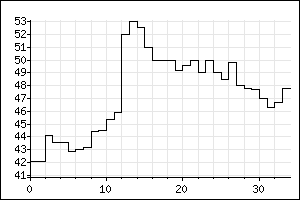
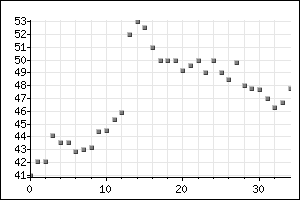
- "square": Draw square lines between data points.
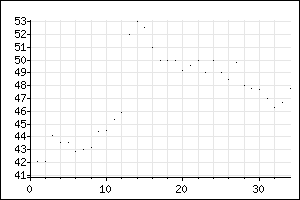
- "points": Plot the data points with dots.
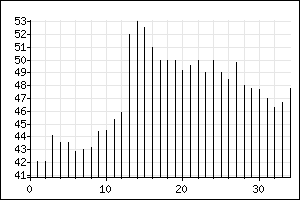
- "impulse": Draw a line upwards from the bottom to the data point.
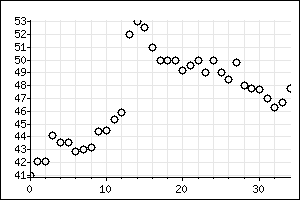
- "circle": Plot the data points using circles. Takes an optional circle size parameter.
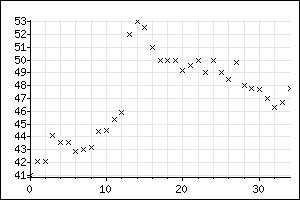
- "cross": Plot the data points using crosses. Takes an optional cross size parameter.
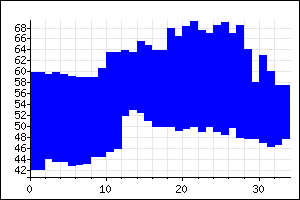
- "fill": Take two data sets and fill the area between them. The data points themselves will be drawn using "square".
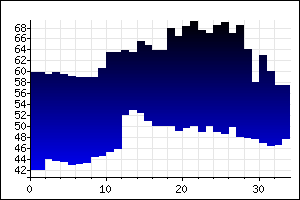
- "fillgradient": The same as fill, but uses a gradient, as explained below.
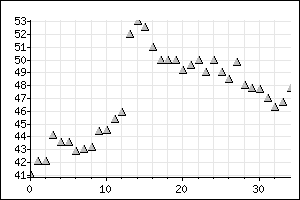
- "triangle": Plot the data points using triangles. Takes an optional "shadow color" paramater.
- "box": Plot the data points using boxes. Takes an optional gradient color parameter -- three colors will be used, in total.
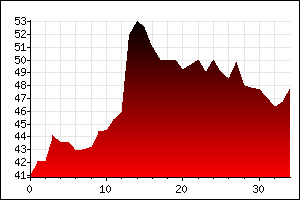
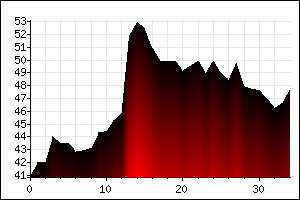
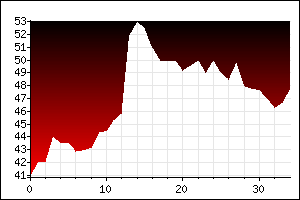
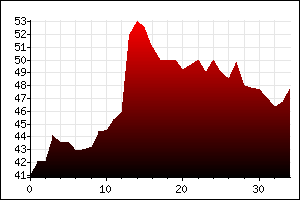
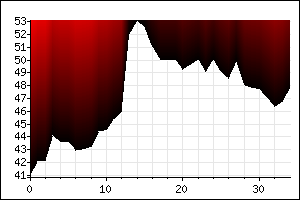
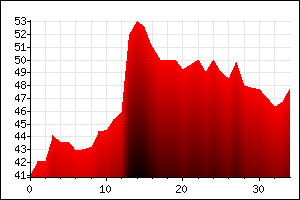
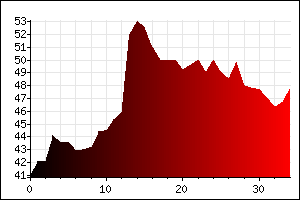
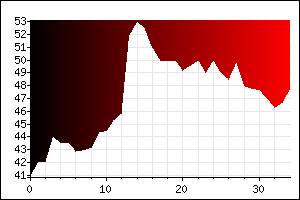
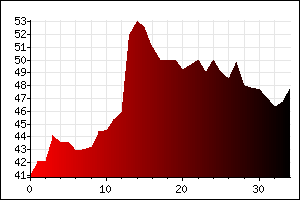
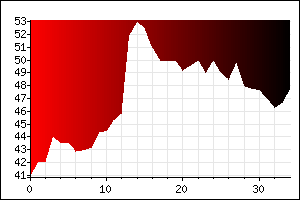
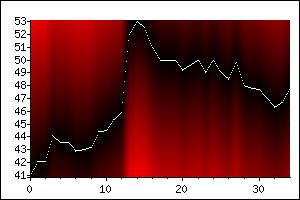
- "gradient": Fill the area under/over the data plot with a gradient color. A secondary color is given, and a parameter can also be used to control the gradient even further. The parameter is a bit mask, and the following bits are defined:
- 1 (style): If set, draw using a dynamic style. If not set, each Y value will have the same color.
- 2 (over/under): If set, draw over the data plot. If not set, draw under the data plot.
- 4 (from/to): Reverse the direction of the gradient.
- 8 (horizontal): Graduate horizontally instead of vertically.
Below is the same data set plotted using different styles.
Below is the same data set plotted using the "gradient" style, but with different parameters.
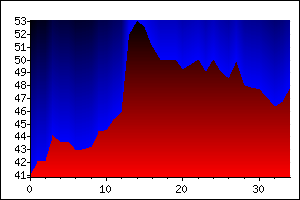
And, of course, you can go completely wild and plot several different gradients in the same chart:
The usefulness of these charts may be rather questionable. Placing the grid over the plot helps some:
And finally, fill and fillgradient plots:
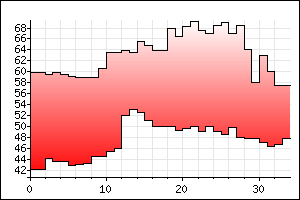
Plotting the upper and lower bounds separately often makes the filling plots look nicer:
Using gradients means slowing down chart generation somewhat. Dynamic gradients are no slower that non-dynamic gradients, but using them means that the charts will be quite a bit larger, since they won't compress as well as non-dynamic gradients. If you have a heavy load, or you have a slow web server, you should try to cache the gradient charts as aggressively as possible.
Caching
PHP is not the most efficient language in the world, and if you have a busy web site, generating masses of images may bog your server down. Chart therefore has a caching mechanism.
If you supply a third parameter to the chart function, then Chart will first check to see if that file exists before doing anything. If it does, it will output that file and exit. If it does not exist, Chart will compute the chart as usual, but before outputting the newly-generated chart, it will save it to the cache first, using that supplied file name.
PHP scripts that use this would have something like the following at the start of the script:
$chart = new chart(200, 100, "nice-plot");# ... The rest of the program.
Then PHP would only create the image once, and every other access would be dealt with from the cache.
In this case, this would produce a totally static plot, and you might as well just generate the GIF and use that instead of the PHP script. One reason to still do it this way is that it's often just simpler. For instance, all the example plots you're seeing on this page most probably came from the cache.
Most real dynamic plots usually have some input values, though. A recommended way to deal with that would be:
$chart = new chart(200, 100, sprintf("other-plot/stuff=%d/thing=%s/gif", $stuff, $thing);# ... The rest of the program.
This chart depends on two parameters -- stuff and thing. If these vary wildly, many GIFs will be generated and stored in the cache. In that case, setting up a cron job to delete images that haven't been accessed in, say, a few days, would be necessary. Something like the following would probably do the trick; it first deletes all files that haven't been accessed in three days, and then it removes all empty directories:
#!/bin/shfind /var/tmp/cache -type f -atime +3 -exec ls -l {} /;find /var/tmp/cache -type d -empty -exec ls -ld {} /;
This should, of course, be run as the same user that generated the files, which would normally be nobody.
It is probably not a good idea to generate a flat cache. If many thousand images are cached, accessing files in such a big directory will be slow. Therefore it is probably usually better to generate a tree structure, as shown in the example above.
If your plot is not uniquely determined by the parameters, caching becomes problematic, and will give you bad results. If, for instance, you have a chart that displays different data depending on the date, you could get around this problem by including the date in the cache file name. Then the chart would only be generated once per day.
While developing new charts, the cache usually gets in the way. If that's the case, set the global $chart_debug variable to true. This will override the cache and force Chart to re-generate the images every time.
The global $chart_cache_directory variable says what the root directory of the cache is. It defaults to "/var/tmp/cache".
GIF and PNG
As of version 0.4, Chart defaults to outputting PNG images instead of GIF images. This is because newer versions of the gd library (which PHP uses to create images) doesn't include GIF creating functions, since the patent holders to the GIF algorithm demand money for the usage of that algorithm. If you absolutely have to generate GIF images (and there's really no need, since all modern web browsers parse PNG images just fine), you need to link PHP with gd version 1.3 or earlier, and set the global $chart_use_png variable to false.
Grids and ticks
Chart uses heuristiscs developed over the years to find pleasing numbers to put on the X and Y axes, as well as spacing the grid lines in a sensible way. More work needs to be done, but the following seems to work quite well:
- On the Y axes, numbers divisible by 1, 2 and 5 are used. (Divided and multiplied by 10, etc.)
- If the X axes is a clock axes (i. e., time), Chart tries to use whole hours, half hours, quarter hours, etc.
- For dates on the X axes, Chart tries to use years, months, weeks, etc.
Bugs
Chart hasn't been optimized for speed at all. There are probably many things one can do to make it run faster. Patches are welcome.
Possible coming features
Putting text and other images into the charts might be nice. Naming the plots would be convenient. And just about anything else that gnuplot does with two-dimensional plots would be spiffy.
Other PHP Packages
At the time when I started writing Chart, there wasn't anything like it available. Now there are several other packages that does similiar things, using different approaches. One interesting package is JpGraph, which seems to be able to generate very nice charts indeed. That page also has links to other packages.
Contributors
- Christoph Lameter supplied patches for cdate, ctime, box and triangle extensions.
- Ho Siaw Ping, Ryan fixed the x_ticks code.
Bugs
- If you use a different locale than english, stuff will probably not work well. setlocale(LC_ALL, "english"); to set the right locale.
Contact
Chart is © 1999, 2000, 2001 Lars Magne Ingebrigtsen.
Chart is released under the GNU General Public License. This means that Chart is free. This web page is the documentation to Chart and is covered by the same license.
Patches, new features, bug reports and other stuff can be sent to Lars Magne Ingebrigtsen.
