IOS报表解决方案 使用开源组件iChartjs(一)
前几天写了android系统使用ichartjs简单实现移动端图表的例子,怎么能少了乔帮主的ios系统呢 实现效果更炫的ichartjs图表
我们来看看如何实现呢
同android系统一样 使用UIWebView就可以实现 ios对html5的支持也很完美
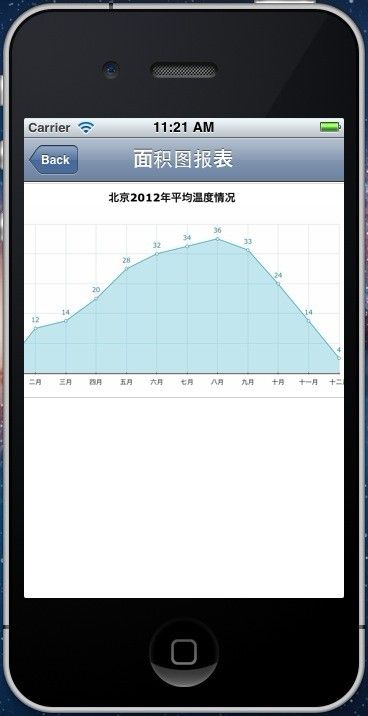
首先来看效果图
实现效果是首页面展示图标的列表 选择后进入图表详细 来展示本地的图标文件 即为html文件
用的是iphone的模拟器 ios的UIWebView缩放效果还是很不错的 可以自由的进行缩放
下面来看实现:
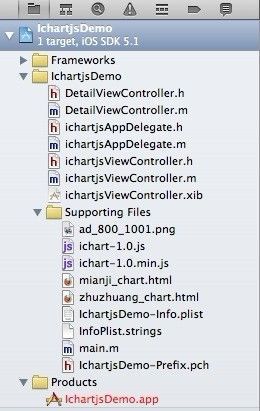
首先看下项目结构图
将html js文件放在资源文件包内 这里主要用到ichart-1.0.min.js
首界面ichartjsViewController 继承自UIViewController 使用UITableView 所以需要实现UITableViewDataSource, UITableViewDelegate 两个协议
初始化UITableView
tableViewMain = [[UITableView alloc] initWithFrame:CGRectMake(0, 50, 320, 420) style:UITableViewStyleGrouped];
    //    tableViewMain.style = UITableViewStyleGrouped;
    [tableViewMain setDelegate:self];
    [tableViewMain setDataSource:self];
    [self.view addSubview:tableViewMain];
因为这个只有一个分组 所以直接可以写死sectionName
- (NSString *) tableView:(UITableView *)tableView titleForHeaderInSection:(NSInteger)section
{
    return @"图表Demo";
}

- (NSInteger) tableView:(UITableView *)tableView numberOfRowsInSection:(NSInteger)section
{
    return dataArray.count;
}

- (UITableViewCell *) tableView:(UITableView *)tableView cellForRowAtIndexPath:(NSIndexPath *)indexPath
{
    static NSString *SimpleTableIdentifier = @"SimpleTableIdentifier";
    UITableViewCell *cell = [tableView dequeueReusableCellWithIdentifier:SimpleTableIdentifier];
    if (cell == nil) {
        cell = [[[UITableViewCell alloc] initWithStyle:UITableViewCellStyleDefault reuseIdentifier:SimpleTableIdentifier] autorelease];
    }
    cell.accessoryType = UITableViewCellAccessoryDetailDisclosureButton;
    cell.text = [dataArray objectAtIndex:indexPath.row ];
    NSLog(@"cell   value ===  %@",[dataArray objectAtIndex:indexPath.row ]);
    return cell;
}
实现协议的方法 加载UITableView的数据
cell.accessoryType = UITableViewCellAccessoryDetailDisclosureButton;
设置Cell的样式 显示详细点击按钮 点击事件代码如下
- (void)tableView:(UITableView *)tableView accessoryButtonTappedForRowWithIndexPath:(NSIndexPath *)indexPath{


    DetailViewController *detailVC = [[DetailViewController alloc] init];

    NSString *test = @"test";
    if(indexPath.row == 0){
        detailVC.charttype = 0;
        test = @"面积图报表";
    }
    if(indexPath.row == 1){
        detailVC.charttype = 1;
        test = @"柱状图报表";
    }

    detailVC.navigationItem.title = test;
    [self.navigationController pushViewController:detailVC animated:YES];
}
点击进入详细的ViewDetailViewController 通过
detailVC.charttype = 0;
判定传递图表类型
图表展示界面 只需初始化UIWebView 并加载本地HTML即可 初始化代码如下//创建UIWebView
UIWebView *WebView = [[UIWebView alloc] initWithFrame:CGRectMake(0, 0, 320, 400)];
[WebView setUserInteractionEnabled:YES];
WebView.scalesPageToFit =YES;
[WebView setBackgroundColor:[UIColor clearColor]];
[WebView setOpaque:NO];//使网页透明
WebView.delegate = self;
if(charttype==0){
NSString *path = [[NSBundle mainBundle] pathForResource:@"mianji_chart.html" ofType:nil];
[WebView loadRequest:[NSURLRequest requestWithURL:[NSURL fileURLWithPath: path]]];
}else{
NSString *path = [[NSBundle mainBundle] pathForResource:@"zhuzhuang_chart.html" ofType:nil];
[WebView loadRequest:[NSURLRequest requestWithURL:[NSURL fileURLWithPath: path]]];
}
大功告成 这样静态的图表界面就展示出来了 像上面的效果图一样 可以随意进行缩放
这里需要引入ichart-1.0.min.js 但是需要注意一点 XCode会自动编译.js文件的 这个再XCode左侧 issue navigator视图中就能看到黄叹号提示 js编译有警告
如果js被编译 会导致js代码不能正常执行的 所以这里要设置ichart-1.0.min.js为不自动编译的文件 需要在targets视图中进行配置
不同版本的XCode配置不一样 这是方法可以参考http://blog.csdn.net/lovenjoe/article/details/7383376 来进行
我的XCode版本4.3.2 配置如下
在项目配置视图中 选择targets --》 Build Phases 详细配置方式就可以参考刚才博客的介绍了 这里不作详细说明
OK 下面是demo源码 可以下载作参考 Demo项目源码下载
下面会继续深入学习通过UIWebView进行js调用来动态更新图表数据的实现 很快就会跟大家分享的~~~~


