三个PHP图表类库
一
Jpgraph
1.1
介绍
超字了...
1.3
实例介绍
只要把
example
中的
require_once
路径改了就放进来用吧,我下的是最新版的
jpgraph-3.5.0b1
,反正测试嘛,我记得跟
3.0.7
还是有差别的,把文件名都重新命名过了,这个不错,原先都是
example1~n
,都不知道是个什么东西。好吧随便打开第一个文件
accbarex1.php
,是个柱状图
BarPlot
,还有其他
LinePlot
线性图
,PiePlot
饼状图等。代码很简单,传递数据
->
设置图的属性
->
设置图的节点属性
->
画图设置图的标题、字体、颜色等
->
展示,具体可以看下面的代码。就是中文有点纠结的,这个不是他的错,是我们的
GD
库编译的时候有问题,所以这里我把文字转为
html
实体展示。很简单吧,可以尝试下玩玩。
<?php // content="text/plain; charset=utf-8"
require_once ('../jpgraph.php');
require_once ('../jpgraph_bar.php');
$data1y=array(-8,8,9,3,5,3); //blue
那条的数据
$data2y=array(18,20,16,10,5,6); //orange
那条的数据
// Create the graph. These two calls are always required
$graph = new Graph(800,500); //
大小
宽
*
高
$graph->SetScale("textlin"); //
设置刻度模式
还有
intint
、
linlin
、
log
、
lin
、
textlog
等其他模式
$graph->SetShadow();
$graph->img->SetMargin(40,30,20,40); //
设置图表边距,就跟
css
里
margin
属性是一样的
// Create the bar plots
$b1plot = new BarPlot($data1y); //
创建新的
BarPlot
对象
各种不同图表就是通过调用不通对象实现的
,BarPlot
就是柱状的,还有
LinePlot
线性图
,PiePlot
饼状图
$b1plot->SetFillColor("orange"); //
设置图的颜色
$b1plot->value->Show(); //
展示
$b2plot = new BarPlot($data2y); //
一样的
$b2plot->SetFillColor("blue");
$b2plot->value->Show();
// Create the grouped bar plot
$gbplot = new AccBarPlot(array($b1plot,$b2plot)); //
开始画图了
$graph->Add($gbplot); //
在统计图上绘制曲线
$graph->title->Set(iconv_arr("Phpwind
图表测试
")); //
设置图表标题
这里
iconv_arr
是我自己加的,为了支持我们伟大的中文要把你的当前编码转化为
html
实体
$graph->xaxis->title->Set(iconv_arr("
这个大概是月份吧
")); //
设置
X
轴标题
$graph->yaxis->title->Set(iconv_arr("
这个是
Y
轴
")); //
设置
Y
轴标题
$graph->title->SetFont(FF_SIMSUN,FS_BOLD); //
设置标题字体,这里字体默认是
FF_FONT1
,为了中文换成
FF_SIMSUN
$graph->yaxis->title->SetFont(FF_SIMSUN,FS_BOLD); //
设置
X
轴标题字体
$graph->xaxis->title->SetFont(FF_SIMSUN,FS_BOLD); //
设置
Y
轴标题字体
$graph->Stroke(); //
输出图像
function iconv_arr($data){
if(is_array($data)){
foreach($data as $k=>$v){
$data[$k] = iconv_arr($v);
}
}else{
$data = mb_convert_encoding($data, "html-entities","gbk" );
}
return $data;
}

二
pChart
2.1
介绍
超字了...
2.3
实例介绍
同样拿个实例介绍下,我用的是最新版的
pChart 1.27
哦,
pChart
的工作流程主要分为以下几步:
(1)
读取用于生成图表数据(数据库、文件)
(2)
设计图形
(3)
把数据导入图形
(4)
配置图形、文字样式
(5)
成功图形
同样
pChart
也是需要
GD
库支持的,所以中文乱码问题也是存在的,这边还是用上面那种方法解决哦,刚用
Jpgraph
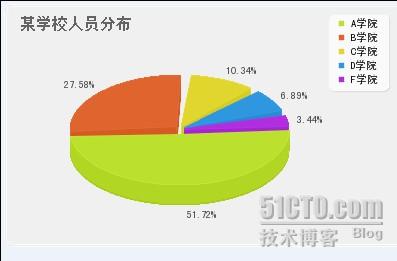
画过一个柱形图,那现在搞一个饼图玩玩吧。
<?php
include("pChart/pData.class"); //
数据类
include("pChart/pChart.class"); //
画图类
//
准备好画图的数据
$arr1 = array(15,8,3,2,1); //
对应数据
$arr2 = iconv_arr(array('B2B','
淘宝
','
支付宝
','
阿里云
','
其他
')); //
数据的文字
,
和数据位置对应
,
这里也用了
iconv_arr
转换中文
//
第一步
获得饼图数据
$data = new pdata;
$data->AddPoint($arr1,"serie1"); //
装入数据并命名为
serie1
$data->AddPoint($arr2,"serie2"); //
装入说明并命名为
serie2
$data->AddAllSeries(); //
提交数据
$data->SetAbsciseLabelSerie("serie2"); //
设置标签
//
第二步
画图形框架
$im = new pchart(400,300); //
创造一个画布并赋予尺寸
$im->drawFilledRoundedRectangle(7,7,413,243,5,240,240,240); //
画一个圆角矩形
(x1,y1,x2,y2,
圆角半径
,R,G,B)
$im->drawRoundedRectangle(5,5,415,245,5,230,230,230); //
画圆角矩形
"
框
"
//
第三步
把数据导入画好的图形内
$im->setFontProperties("Fonts/simhei.ttf",8); //
设置字体及大小,需要把字体拷到
Fonts
文件夹下,或者
windos
指定到
c/system32/fonts
//
画一个
3
维饼图专用函数
//$data,
饼图结构数据
//$data
数据参数
//$XPos,
圆心的
X
坐标
//$YPos,
圆心的
Y
坐标
//$Radius=100,
半径
//$DrawLabels=PIE_NOLABEL,
标签样式
(
百分比和标签
)
//$EnhanceColors=false,
边框渲染
//$Skew=50,
倾斜角度
//$SpliceHeight=20,
饼的厚度
//$SpliceDistance=5,
各板块间距离
//$Decimals=2
显示百分比小数位数
$im->drawPieGraph($data->GetData(),$data->GetDataDescription(),180,130,110,PIE_PERCENTAGE_LABEL,false,50,20,5,2);
//
饼图的标签列表
(
从左至右顺序
)
//$XPos,
标签框左上角的
X
坐标
//$YPos,
标签框左上角的
Y
坐标
//$data
数据参数
//$R,$G,$B
背景颜色
$im->drawPieLegend(330,15,$data->GetData(),$data->GetDataDescription(),250,250,250);
//
第四步
制作图表标题和一些样式
$im->setFontProperties("Fonts/simhei.ttf",12);
//
写入标题的函数
//$XPos,
标签框左上角的
X
坐标
//$YPos,
标签框左上角的
Y
坐标
//$Value,
标题文字内容
//$R,$G,$B,
文字颜色
//$XPos2=-1,$YPos2=-1,
座标调整的设置
//$Shadow=FALSE
阴影开关
$im->drawTitle(20,30,iconv_arr('
阿里集团人员分布
'),100,100,100,-1,-1,false);
//
第五步
输出保存图形
$im->Render("test.png");//
保存为一个图形文件
function iconv_arr($data){
if(is_array($data)){
foreach($data as $k=>$v){
$data[$k] = iconv_arr($v);
}
}else{
$data = mb_convert_encoding($data, "html-entities","gbk" );
}
return $data;
}

还有几个方法
ImportFromCSV
从
csv
文件导入,
loadColorPalette
从
txt
文件读取,还是很给力的吧,快自己试试吧。
三 phplot

超字了...
3.3
实例介绍
phplot
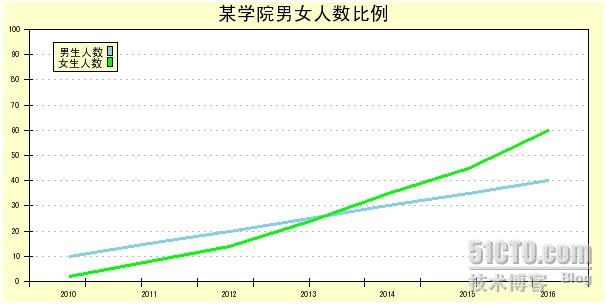
的工作流程也是差不多的,这里就写一个线性图来玩玩吧。具体请看代码,比较简单,写了详细说明的。
<?php
require_once 'phplot.php';
//
设置数据
$data = array(
array('2010', 10, 2),
array('2011', 15, 8),
array('2012', 20, 14),
array('2013', 25, 24),
array('2014', 30, 35),
array('2015', 35, 45),
array('2016', 40, 60)
);
$p = new PHPlot(600, 300);
$p->SetDefaultTTFont('Fonts/simhei.ttf'); //
设置字体,还是支持中文的吧
$p->SetTitle(iconv_arr('Phpwind
疾风学院男女人数比例
')); //
设置标题,还是用
iconv_arr
来解决中文
# Select the data array representation and store the data:
$p->SetDataType('text-data'); //
设置使用的数据类型,在这个里面可以使用多种类型。
$p->SetDataValues($data); //
把一个数组
$data
赋给类的一个变量
$this->data_values.
要开始作图之前调用。
$p->SetPlotType('lines'); //
选择图表类型为线性
.
可以是
bars,lines,linepoints,area,points,pie
等。
$p->SetPlotAreaWorld(0, 0, 7, 100); //
设置图表边距
# Select an overall image background color and another color under the plot:
$p->SetBackgroundColor('#ffffcc'); //
设置整个图象的背景颜色。
$p->SetDrawPlotAreaBackground(True); //
设置节点区域的背景
$p->SetPlotBgColor('#ffffff'); //
设置使用
SetPlotAreaPixels()
函数设定的区域的颜色。
$p->SetLineWidth(3); //
线条宽度
# Draw lines on all 4 sides of the plot:
$p->SetPlotBorderType('full'); //
设置线条类型
# Set a 3 line legend, and position it in the upper left corner:
$p->SetLegend(iconv_arr(array('
男生人数
', '
女生人数
'))); //
显示在一个图列框中的说明
$p->SetLegendWorld(0.3, 95); //
设定这个文本框位置
# Generate and output the graph now:
$p->DrawGraph();
function iconv_arr($data){
if(is_array($data)){
foreach($data as $k=>$v){
$data[$k] = iconv_arr($v);
}
}else{
$data = mb_convert_encoding($data, "html-entities","gbk" );
}
return $data;
}

这三个是
PHP
图表类库,对于一些需要交互的图表(比如需要点击某个节点显示大图)还是不能满足需求,只能用
highcharts
、
flot
、
open-flash-chart
这种
js
和
flash
图表工具来处理。