【Java EE 学习 74 下】【数据采集系统第六天】【使用Jfreechart的统计图实现】【将JFreechart整合到项目中】
之前说了JFreechart的基本使用方法,包括生成饼图、柱状统计图和折线统计图的方法。现在需要将其整合到数据采集系统中根据调查结果生成三种不同的统计图。
一、统计模型的分析和设计
实现统计图显示的流程:单击导航栏中的“我的调查”超链接->在调查列表中单击指定的调查中的“分析”超链接->统计Action获取请求参数(questionId)并根据该值计算统计图所需要的所有参数,生成统计图,并将统计图以流的形式返回到前端显示。为了简单起见,这里直接在浏览器新开了一个窗口显示统计图,并没有进行弹窗显示。
统计图需要的数据主要有:
1.当前问题有多少人回答
2.该问题的每个选项有多少人回答
这两种数据是实现统计图所需要的所有数据。
那么根据需求可以得到需要的实体有“选项”、“问题”两个,其中,问题实体已经在前面有过定义,那么还需要重新定义一个吗?实际上我们还需要重新定义一个问题实体,因为如果贸然给问题实体添加一个count属性,于理不合;不仅如此还需要给问题添加一个“选项列表”的字段,更是不知所谓。经过分析,设计的另一个问题实体数据结构如下:
给它设计三个字段,名为QuestionStatisicModel:
//对应的那个问题
    private Question question;
    //回答的人数
    private int count;
    //问题中每个选项的统计情况
    private List<OptionStatisticModel> osms=new ArrayList<OptionStatisticModel>();//这个直接初始化的时候赋值,方便以后调用
接着是选项实体,选项实体的设计比较复杂,这里的选项必须能够表示九种类型的所有选项类型,并且不仅仅需要保存选项的内容,还需要保存与之对应的索引值,我们采集完成之后保存到数据库中的都是答案的索引值。
针对就九州九种类型的题型,现设计如下的数据结构,名为OptionStatisticModel:
 1   //选项标签
 2     private String optionLabel;
 3     //选项的索引值
 4     private int optionIndex;
 5     //矩阵型的行标签
 6     private String matrixRowLabel;
 7     //矩阵型的航标签的索引值
 8     private int matirxRowIndex;
 9     //矩阵型的列标签
10     private String matrixColLabel;
11     //矩阵型问题的列标签的索引值
12     private int matrixColIndex;
13     //矩阵型下拉列表标签
14     private String matrixSelectLabel;
15     //矩阵型下拉列表标签的索引值
16     private int matrixSelectIndex;
17     //该选项有多少人选择
18     private int count;
由于这两个不保存到数据库,所以使用其他包存放这两个类:com.kdyzm.domain.statistic
二、统计数据,封装成QuestionStatisticModel对象
我们需要一个方法,输入参数是Question对象,输出参数是QestionStatisticModel,我们只要得到了QuestionStaticsticModel对象就相当于拿到了统计图需要的所有数据。
1.怎么获取该问题有多少人回答
每个答案都有questionId来标识,我们只需要统计出在答案表中有多少个questionid和指定的questionid相同即可。
String hql="select count(*) from Answer a where questionId=?";
        int qcount=answerDao.getQuestionResponseCount(hql,question.getQuestionId());
2.选项统计问题
选项统计是比较复杂的,这里将非矩阵式问题和矩阵式问题分别处理,同时针对问题6(文本框类型的问题)这种类型的就不做统计了。
统计选项问题的核心是使用sql中的模糊查找功能,即like关键字,为了更加方便的使用这一点,需要在数据库中的答案字符串两端加上',',不需要修改数据库,直接使用字符串连接方法即可:
select count(*) from Answer a where a.questionId=? and concat(',',a.answerIndexs,',') like ?
?是占位符,之后使用Question中的每个选项的索引值填充,即可统计出每个选项的被选中的个数。
(1)针对前五种类型的题目,使用的解决方案是:
 1 String []optionArr=question.getOptionTextArr();
 2                 OptionStatisticModel optionStatisticModel=null;
 3                 for(int i=0;i<optionArr.length;i++){
 4                     String option=optionArr[i];
 5                     //这里i就是索引值,而opiton就是标签
 6                     optionStatisticModel=new OptionStatisticModel();
 7                     optionStatisticModel.setOptionLabel(option);
 8                     optionStatisticModel.setOptionIndex(i);
 9                     ocount=answerDao.getOptionResponseAmount(hql,question.getQuestionId(),"%,"+i+",%");
10                     optionStatisticModel.setCount(ocount);
11                     options.add(optionStatisticModel);
12                 }
13                 //这里还需要考虑到有其它选项的情况
14                 if(question.isOther()){
15                     //option就是标签
16                     String option="other";
17                     optionStatisticModel=new OptionStatisticModel();
18                     optionStatisticModel.setOptionLabel(option);
19                     ocount=answerDao.getOptionResponseAmount(hql,question.getQuestionId(),"%other%");
20                     optionStatisticModel.setCount(ocount);
21                     options.add(optionStatisticModel);
22                 }
23                 break;
注意%通配符的使用。
(2)针对矩阵式问题的统计方案
矩阵式问题处理方式类似,只不过需要进行循环的嵌套而已,需要两重循环(矩阵式单选框问题或者矩阵式复选框类型)或者三重循环(矩阵式下拉列表选项)。
 1 String []rows=question.getMatrixRowTitleArr();
 2 String []cols=question.getMatrixColTitleArr();
 3 String []selectOptionArr=question.getMatrixSelectOptionArr();
 4 //这里至少需要两重循环,最多需要三重循环(是下拉列表框的类型)
 5 for(int i=0;i<rows.length;i++){
 6     for(int j=0;j<cols.length;j++){
 7         //这里分为两种情况,一种情况是radio/checkbox的类型,一种情况是select类型
 8
 9         //radio/checkbox类型的
10         if(question.getQuestionType()<8){
11             optionStatisticModel=new OptionStatisticModel();
12             optionStatisticModel.setMatirxRowIndex(i);
13             optionStatisticModel.setMatrixColLabel(rows[i]);
14             optionStatisticModel.setMatrixColIndex(j);
15             optionStatisticModel.setMatrixColLabel(cols[j]);
16
17             ocount=answerDao.getOptionResponseAmount(hql, question.getQuestionId(), "%,"+i+"_"+j+",%");
18             optionStatisticModel.setCount(ocount);
19             options.add(optionStatisticModel);
20         }
21         //select类型的
22         if(question.getQuestionType()==8){
23             for(int k=0;k<selectOptionArr.length;k++){
24                 if(i==0&&j==0&&k==1){
25                     System.out.println("继续检测");
26                 }
27                 optionStatisticModel=new OptionStatisticModel();
28                 optionStatisticModel.setMatirxRowIndex(i);
29                 optionStatisticModel.setMatrixColLabel(rows[i]);
30                 optionStatisticModel.setMatrixColIndex(j);
31                 optionStatisticModel.setMatrixColLabel(cols[j]);
32                 optionStatisticModel.setMatrixSelectIndex(k);
33                 optionStatisticModel.setMatrixSelectLabel(selectOptionArr[k]);
34
35                 ocount=answerDao.getOptionResponseAmount(hql, question.getQuestionId(), "%,"+i+"_"+j+"_"+k+",%");
36                 optionStatisticModel.setCount(ocount);
37                 options.add(optionStatisticModel);
38             }
39         }
40     }
41 }
3.统计方法的完整代码
  1 public QuestionStatisticModel statics(Question question){
  2     System.out.println("访问了QuestionStatisticService的statics方法");
  3
  4
  5     /*question.setTitle("测试事务");
  6     questionDao.updateEntity(question);*/
  7
  8     //该方法逻辑上分析是加上了事务的,但是需要进行测试是否真正加上了事务。
  9     QuestionStatisticModel questionStatisticModel=new QuestionStatisticModel();
 10
 11     //设置Question对象
 12     questionStatisticModel.setQuestion(question);
 13
 14     //获取问题回答人数
 15     String hql="select count(*) from Answer a where questionId=?";
 16     int qcount=answerDao.getQuestionResponseCount(hql,question.getQuestionId());
 17     questionStatisticModel.setCount(qcount);
 18
 19     //最重要的一个问题就是获取每个选项的统计问题,即填充List<OptionStatisticsModel>列表
 20     List<OptionStatisticModel>options=questionStatisticModel.getOsms();
 21
 22     int questionType=question.getQuestionType();
 23     //使用到的hql语句都只是同一个
 24     hql="select count(*) from Answer a where a.questionId=? and concat(',',a.answerIndexs,',') like ?";
 25     //每个选项的统计数据初始化为0
 26     int ocount=0;
 27     switch(questionType){
 28         case 0:
 29         case 1:
 30         case 2:
 31         case 3:
 32         case 4:
 33             String []optionArr=question.getOptionTextArr();
 34             OptionStatisticModel optionStatisticModel=null;
 35             for(int i=0;i<optionArr.length;i++){
 36                 String option=optionArr[i];
 37                 //这里i就是索引值,而opiton就是标签
 38                 optionStatisticModel=new OptionStatisticModel();
 39                 optionStatisticModel.setOptionLabel(option);
 40                 optionStatisticModel.setOptionIndex(i);
 41                 ocount=answerDao.getOptionResponseAmount(hql,question.getQuestionId(),"%,"+i+",%");
 42                 optionStatisticModel.setCount(ocount);
 43                 options.add(optionStatisticModel);
 44             }
 45             //这里还需要考虑到有其它选项的情况
 46             if(question.isOther()){
 47                 //option就是标签
 48                 String option="other";
 49                 optionStatisticModel=new OptionStatisticModel();
 50                 optionStatisticModel.setOptionLabel(option);
 51                 ocount=answerDao.getOptionResponseAmount(hql,question.getQuestionId(),"%other%");
 52                 optionStatisticModel.setCount(ocount);
 53                 options.add(optionStatisticModel);
 54             }
 55             break;
 56         /*
 57          * 类型5是文本框类型,不做统计
 58          * */
 59         case 6:
 60         case 7:
 61         case 8:
 62             String []rows=question.getMatrixRowTitleArr();
 63             String []cols=question.getMatrixColTitleArr();
 64             String []selectOptionArr=question.getMatrixSelectOptionArr();
 65             //这里至少需要两重循环,最多需要三重循环(是下拉列表框的类型)
 66             for(int i=0;i<rows.length;i++){
 67                 for(int j=0;j<cols.length;j++){
 68                     //这里分为两种情况,一种情况是radio/checkbox的类型,一种情况是select类型
 69
 70                     //radio/checkbox类型的
 71                     if(question.getQuestionType()<8){
 72                         optionStatisticModel=new OptionStatisticModel();
 73                         optionStatisticModel.setMatirxRowIndex(i);
 74                         optionStatisticModel.setMatrixColLabel(rows[i]);
 75                         optionStatisticModel.setMatrixColIndex(j);
 76                         optionStatisticModel.setMatrixColLabel(cols[j]);
 77
 78                         ocount=answerDao.getOptionResponseAmount(hql, question.getQuestionId(), "%,"+i+"_"+j+",%");
 79                         optionStatisticModel.setCount(ocount);
 80                         options.add(optionStatisticModel);
 81                     }
 82                     //select类型的
 83                     if(question.getQuestionType()==8){
 84                         for(int k=0;k<selectOptionArr.length;k++){
 85                             if(i==0&&j==0&&k==1){
 86                                 System.out.println("继续检测");
 87                             }
 88                             optionStatisticModel=new OptionStatisticModel();
 89                             optionStatisticModel.setMatirxRowIndex(i);
 90                             optionStatisticModel.setMatrixColLabel(rows[i]);
 91                             optionStatisticModel.setMatrixColIndex(j);
 92                             optionStatisticModel.setMatrixColLabel(cols[j]);
 93                             optionStatisticModel.setMatrixSelectIndex(k);
 94                             optionStatisticModel.setMatrixSelectLabel(selectOptionArr[k]);
 95
 96                             ocount=answerDao.getOptionResponseAmount(hql, question.getQuestionId(), "%,"+i+"_"+j+"_"+k+",%");
 97                             optionStatisticModel.setCount(ocount);
 98                             options.add(optionStatisticModel);
 99                         }
100                     }
101                 }
102             }
103             break;
104         default:break;
105     }
106     return questionStatisticModel;
107 }
三、前端页面的设计
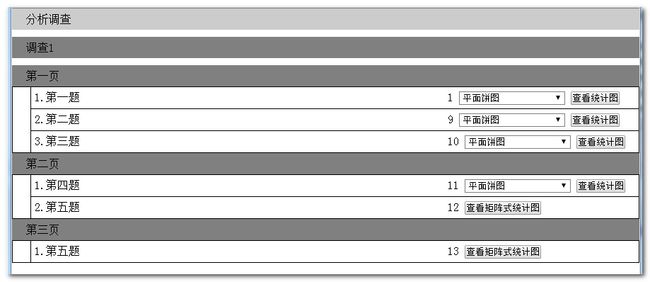
必须将所有调查的所有页面的所有问题都显示出来。针对不同类型的问题有不同的提示,比如针对前5种类型的问题,我们需要给出查看各种统计图的按钮;如果是文本框类型,则直接给出“不可统计”的提示;如果是矩阵类型的问题,则使用普通的饼状图、直方图或者折线图都不能表示出来了,我们直接给出“查看矩阵类型统计图”的按钮,综合分析之后,设计的核心代码如下:
 1 <s:iterator value="%{#page.questions}" var="question" status="qst">
 2     <tr>
 3         <s:if test="#qst.index==0">
 4             <td width="15px" rowspan='<s:property value="%{#page.questions.size()}"/>'></td>
 5         </s:if>
 6         <td align="left">
 7             <s:property value="#qst.count+'.'+#question.title"/>
 8             <div style="display:inline-block;float: right;margin-right: 10px;width: 30%;">
 9                 <s:if test="#question.questionType==5">
10                     不可统计
11                 </s:if>
12                 <s:elseif test="#question.questionType>=6">
13                     <s:form action="StatisticAction_statisticMatrix.action" namespace="/">
14                         <s:hidden name="questionId">
15                             <s:property value="%{#question.questionId}"/>
16                         </s:hidden>
17                         <s:submit value="查看矩阵式统计图"/>
18                     </s:form>
19                 </s:elseif>
20                 <s:else>
21                     <s:form action="StatisticAction_statistic.action" namespace="/">
22                         <s:hidden name="questionId">
23                             <s:property value="%{#question.questionId}"/>
24                         </s:hidden>
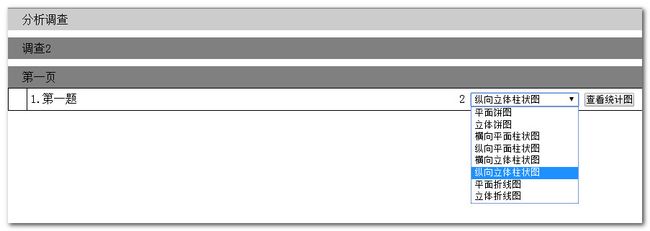
25                         <s:select name="statisticType" cssStyle="width:150px;border:1px solid gray;text-align:center;" list="#{0:'平面饼图',1:'立体饼图',2:'横向平面柱状图',3:'纵向平面柱状图',4:'横向立体柱状图',5:'纵向立体柱状图',6:'平面折线图',7:'立体折线图'}"></s:select>
26                         <s:submit value="查看统计图"/>
27                     </s:form>
28                 </s:else>
29             </div>
30         </td>
31     </tr>
32 </s:iterator>
运行界面如下:
四、Action的统计方法设计
Action中的统计方法肩负着“承上启下”的重任,它需要接收前端的请求,还需要调用Service方法,最后整理好再返回到前端。由之前的前端代码可以看出来,我是用了两种方法对矩阵型的问题和非矩阵类型的问题分别加以对待。
1.对于非矩阵式问题,我们结合JFreechart插件进行统计,所以步骤和上一篇的步骤几乎完全相同,只不过处理起来更为复杂而已。
(1)JFreechart和struts2整合
实际上我们不需要JFreechart插件就能够实现,无非是将流写入到前端,但是不推荐这么做,究其原因还是效率的问题。如果我们自己写,大概我们会这么干:首先在Action中顶一个输入流,然后提供set/get方法,在统计方法中通过chart获得输入流,可以使用ByteArrayOutputStream接收chart的输出,然后读到ByteArrayInputStream,然后赋值给Action中的InputStream类型的变量。最后,通过配置文件配置一下即可:
    <result name="success" type="stream">
        <param name="contentType">image/jpeg</param>
        <param name="inputName">is</param>
        <param name="bufferSize">1024</param>
    </result>
这实际上经过了一个“流结果集类型”(org.apache.struts2.dispatcher.StreamResult)进行了处理,该结果集做的事情只是从流中将数据取出然后写出到网络输出流中。然后我们回顾整个流程:chart->输出流->输入流->输出流,好吧,为什么不直接写出到网络输出流呢?因此struts2提供了一个插件专门用于解决这个问题,它解决该问题的方案就是直接将数据写入网络输出流中,在struts2依赖包下就能够找到该jar包:struts2-jfreechart-plugin-2.3.1.2.jar
接着我们需要干两件事:
第一,在Action中配置变量名称为chart的JFreeChart类型的变量并提供set/get方法。
通过查看源代码,我们可以发现插件中的类默认读取的名字就是chart,如果不想使用该名字就需要到strus2配置文件中重写定义覆盖原来的定义。
第二,配置struts2配置文件
<result name="success" type="chart">
  <param name="value">chart</param>
  <param name="type">png</param>
  <param name="width">800</param>
  <param name="height">480</param>
</result>
结果集类型变成chart,同时为了保险起见,将Action中的名字也写一下。
(2)统计非矩阵类型的问题法方法
 1 public String statistic() throws Exception {
 2         chart = null;
 3         /**
 4          * 在统计之前先绑定数据
 5          */
 6         System.out.println("访问了StatisticAction的statistic方法!");
 7         Question question=questionService.getQuestion(questionId);
 8         Survey survey=question.getPage().getSurvey();
 9         SurveyToken surveyToken=new SurveyToken();
10         surveyToken.setSurvey(survey);
11         SurveyToken.bind(surveyToken);
12         System.out.println("即将访问statisticService的统计方法!");
13         QuestionStatisticModel questionStatisticModel = this.statisticService.statics(question);
14         //解除绑定,实际上已经解除绑定过一次了但是好像并不管用
15         SurveyToken.unbind();
16         DefaultPieDataset pieDataset = null;
17         DefaultCategoryDataset categoryDataset = null;
18         try {
19             if (statisticType < 2) {// 饼图
20                 pieDataset = new DefaultPieDataset(); 21                 for (OptionStatisticModel option : questionStatisticModel.getOsms()) { 22  pieDataset.setValue(option.getOptionLabel(), option.getCount()); 23  } 24             } else { // 其它
25                 categoryDataset = new DefaultCategoryDataset(); 26                 for (OptionStatisticModel option : questionStatisticModel.getOsms()) { 27                     categoryDataset.setValue(option.getCount(), option.getOptionLabel(), "第一季度"); 28  } 29  } 30             switch (this.statisticType) {
31             case 0:
32                 // 平面饼图
33                 chart = ChartFactory.createPieChart(questionStatisticModel.getQuestion().getTitle(), pieDataset, true,
34                         false, false);
35                 ((PiePlot)chart.getPlot()).setLabelGenerator(new StandardPieSectionLabelGenerator("{0}/{1}/{2}/{3}"));
36                 break;
37             case 1:
38                 // 立体饼图
39                 chart = ChartFactory.createPieChart3D(questionStatisticModel.getQuestion().getTitle(), pieDataset, true,
40                         true, true);
41                 chart.getPlot().setForegroundAlpha(0.7F); // 设置透明度
42                 ((PiePlot)chart.getPlot()).setLabelGenerator(new StandardPieSectionLabelGenerator("{0}/{1}/{2}/{3}"));
43                 break;
44             case 2:
45                 // 横向平面柱状图
46                 chart = ChartFactory.createBarChart(questionStatisticModel.getQuestion().getTitle(), "", "",
47                         categoryDataset, PlotOrientation.HORIZONTAL, true, true, true);
48                 break;
49             case 3:
50                 // 纵向平面柱状图
51                 chart = ChartFactory.createBarChart(questionStatisticModel.getQuestion().getTitle(), "", "",
52                         categoryDataset, PlotOrientation.VERTICAL, true, true, true);
53                 break;
54             case 4:
55                 chart = ChartFactory.createBarChart3D(questionStatisticModel.getQuestion().getTitle(), "", "",
56                         categoryDataset, PlotOrientation.HORIZONTAL, true, true, true);
57                 break;
58             // 横向立体柱状图
59             case 5:
60                 chart = ChartFactory.createBarChart3D(questionStatisticModel.getQuestion().getTitle(), "", "",
61                         categoryDataset, PlotOrientation.VERTICAL, true, true, true);
62                 break;
63             // 纵向立体柱状图
64             case 6:
65                 /**
66                  * 折线图的生成发生了问题
67                  * TODO 这里的折线图如果都是同一个组中的,那么就不会显示折线图了
68                  * 必须至少有两个组才行
69                  */
70                 chart = ChartFactory.createLineChart(questionStatisticModel.getQuestion().getTitle(), "", "",
71                         categoryDataset, PlotOrientation.VERTICAL, true, false, false);
72                 break;
73             // 平面折线图
74             case 7:
75                 // 立体折线图 break; default:
76                 chart = ChartFactory.createLineChart3D(questionStatisticModel.getQuestion().getTitle(), "", "",
77                         categoryDataset, PlotOrientation.VERTICAL, true, false, false);
78                 break;
79             }
80             // 集中解决中文乱码问题
81             chart.getTitle().setFont(new Font("宋体", Font.BOLD, 30));
82             chart.getLegend().setItemFont(new Font("宋体", Font.PLAIN, 16));
83             if (chart.getPlot() instanceof PiePlot) { 84                 PiePlot piePlot = (PiePlot) chart.getPlot(); 85                 piePlot.setLabelFont(new Font("宋体", Font.PLAIN, 20)); 86             } else { 87                 Font font = new Font("宋体", Font.PLAIN, 15); 88  chart.getCategoryPlot().getDomainAxis().setLabelFont(font); 89  chart.getCategoryPlot().getDomainAxis().setTickLabelFont(font); 90  chart.getCategoryPlot().getRangeAxis().setLabelFont(font); 91  chart.getCategoryPlot().getRangeAxis().setTickLabelFont(font); 92                 chart.getPlot().setForegroundAlpha(0.7F); 93  } 94         } catch (Exception e) {
95             e.printStackTrace();
96         }
97         System.out.println("StatisticAction的统计方法结束");
98         return SUCCESS;
99     }
需要注意的是使用折线图统计的结果是没有的,在这里也只是空有名头而已,倒不是程序有问题,这是折线图本身所的特性决定的;上述粗体部分是饼图和直方图的不同之处。
(3)统计效果图示例
提供了集中几种选项供选择:
饼状图
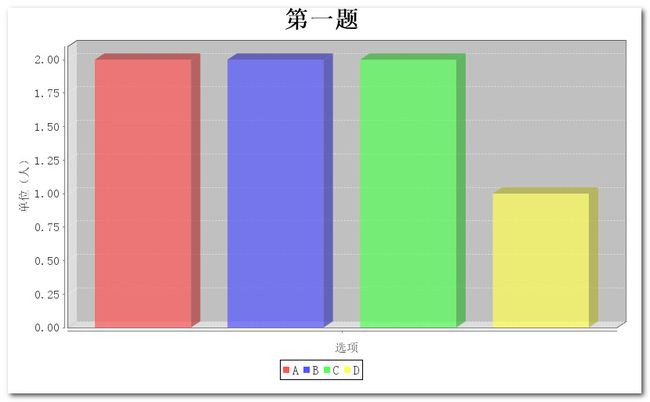
直方图:
折线统计图不适合在这里做,虽然做了,但是没有效果,略。
2.矩阵式问题的统计
矩阵式问题统计没有办法使用JFreechart生成统计图(实际上是不会,JFreechart这种逆天的统计类库什么样的统计图都能够给你搞出来),所以使用自定义的统计图来实现统计,所以好像要简单了好多,统计方法:
1 // 矩阵式问题统计图
2     public String statisticMatrix() throws Exception {
3         question=this.questionService.getQuestion(this.questionId);
4         questionStatisticModel=this.statisticService.statics(question);
5         ActionContext.getContext().getValueStack().push(questionStatisticModel);
6         ActionContext.getContext().put("colors", colors);
7         return ""+question.getQuestionType();
8     }
然后配置文件将其转发到不同的页面进行显示
<!-- 接收不同种类消息,转发到不同的页面 -->
            <result name="6">/statistic/nomalMatrixStatistic.jsp</result>
            <result name="7">/statistic/nomalMatrixStatistic.jsp</result>
            <result name="8">/statistic/selectMatrixStatistic.jsp</result>
可以看出来,矩阵式单选框问题和矩阵式复选框问题使用同一个界面;矩阵式下拉列表类型的问题使用另外一个界面。
(1)矩阵式单选框问题和矩阵式复选框问题使用的界面
1 <table> 2 <tr> 3 <td colspan='<s:property value="%{osms.size+1}"/>'> 4 <s:property value="%{question.title}"/> 5 </td> 6 </tr> 7 <!-- 首先遍历行标签 --> 8 <tr> 9 <td> </td> 10 <s:iterator value="%{question.matrixColTitleArr}"> 11 <td align="center"> 12 <s:property/> 13 </td> 14 </s:iterator> 15 </tr> 16 <s:iterator value="%{question.matrixRowTitleArr}" var="row" status="rst"> 17 <tr> 18 <td align="center"> 19 <s:property/><--列标签--> 20 </td> 21 <s:iterator value="%{question.matrixColTitleArr}" var="col" status="cst"> 22 <td align="center"> 23 <s:property value="getPercent(#rst.index,#cst.index)"/> 24 </td> 25 </s:iterator> 26 </tr> 27 </s:iterator> 28 <tr> 29 <td colspan='<s:property value="%{osms.size+1}"/>'> 30 一共有 <s:property value="%{count}"/> 人参与了问卷! 31 </td> 32 </tr> 33 </table>
这里使用了一个非常重要的方法进行数据的显示统计。getPercent(rowIndex,columnIndex)。
 1 public String getPercent(int row,int col) throws Exception{
 2         int qcount=this.questionStatisticModel.getCount();
 3         int ocount=0;
 4         for(OptionStatisticModel osm:this.questionStatisticModel.getOsms()){
 5             if(osm.getMatirxRowIndex()==row&&osm.getMatrixColIndex()==col){
 6                 ocount=osm.getCount();
 7                 break;
 8             }
 9         }
10         double result=(double)ocount/(double)qcount;
11         result=result*100;
12         DecimalFormat format=new DecimalFormat("#,###.00");
13         return ""+ocount+"{"+format.format(result)+"%}";
14     }
该方法就是遍历所有选项并获取选择该项的人数/总数,注意这里直接使用QuestionStatisticModel对象是没有问题的。
(2)矩阵式下拉列表类型的问题统计
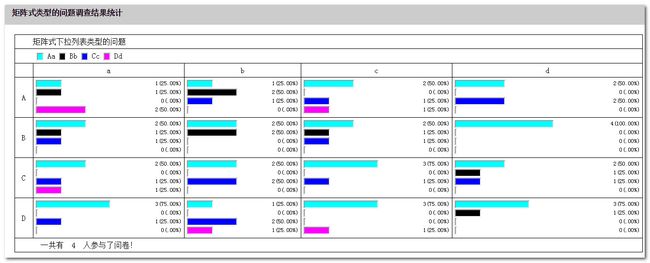
这种类型的问题统计相对来说就比较复杂了。因为这里的每个选项都是下拉列表。但是处理过程无非是从(1)中的2中判断编程3种判断而已。关键是页面的显示比较复杂。我们使用条形的文本框长度来表示百分比。不同颜色的文本框代表不同的下拉列表选型。效果如下图所示:
首先,前端标签是第一步需要设计解决的:
1 <table> 2 <tr> 3 <td colspan='<s:property value="%{osms.size+1}"/>'> 4 <s:property value="%{question.title}"/> 5 </td> 6 </tr> 7 <tr> 8 <td colspan='<s:property value="%{osms.size+1}"/>'> 9 10 <s:iterator value="%{question.matrixSelectOptionArr}" status="st"> 11 <input readonly="readonly" style="width: 10px;height: 10px;background-color: <s:property value='%{#colors[#st.index]}'/>"> 12 <s:property/> 13 </s:iterator> 14 </td> 15 </tr> 16 <!-- 首先遍历表头 --> 17 <tr> 18 <td> </td> 19 <s:iterator value="%{question.matrixColTitleArr}"> 20 <td align="center"> 21 <s:property/> 22 </td> 23 </s:iterator> 24 </tr> 25 <s:iterator value="%{question.matrixRowTitleArr}" var="row" status="rst"> 26 <tr> 27 <td align="center"> 28 <s:property/> 29 </td> 30 <s:iterator value="%{question.matrixColTitleArr}" var="col" status="cst"> 31 <td align="center"> 32 <s:iterator value="%{question.matrixSelectOptionArr}" var="op" status="ost"> 33 <input style="height:10px;float:left;background-color: <s:property value='%{colors[#ost.index]}'/>;width:<s:property value="getWidth(#rst.index,#cst.index,#ost.index)"/>px;" readonly="readonly"/> 34 <span style="font-size:12px;float:right;display: inline-block;text-align: right;"><s:property value="getPercent(#rst.index,#cst.index,#ost.index)"/></span> 35 <br/> 36 </s:iterator> 37 </td> 38 </s:iterator> 39 </tr> 40 </s:iterator> 41 <tr> 42 <td colspan='<s:property value="%{osms.size+1}"/>'> 43 一共有 <s:property value="%{count}"/> 人参与了问卷! 44 </td> 45 </tr> 46 </table>
在这个页面中使用到了两个方法:getPercent(rowIndex,columnIndex,optionIndex)和getWidth(rowIndex,columnIndex,optionIndex),其中前者是重载方法,它有三个参数,之前我们使用的方法是两个参数。
getPercent方法是获取百分比的,二getWidth方法是获取文本框长度的。
getPercent方法:
 1 public String getPercent(int row,int col,int op) throws Exception{
 2         int qcount=this.questionStatisticModel.getCount();
 3         int ocount=0;
 4         for(OptionStatisticModel osm:this.questionStatisticModel.getOsms()){
 5             if(osm.getMatirxRowIndex()==row&&osm.getMatrixColIndex()==col&&osm.getMatrixSelectIndex()==op){
 6                 ocount=osm.getCount();
 7                 break;
 8             }
 9         }
10         double result=(double)ocount/(double)qcount;
11         result=result*100;
12         DecimalFormat format=new DecimalFormat("#,###.00");
13         return ""+ocount+"("+format.format(result)+"%)";
14     }
getWidth方法:获取百分比之后X100*2作为文本框的长度正合适。
 1 public String getWidth(int row,int col,int op) throws Exception{
 2         int qcount=this.questionStatisticModel.getCount();
 3         int ocount=0;
 4         for(OptionStatisticModel osm:this.questionStatisticModel.getOsms()){
 5             if(osm.getMatirxRowIndex()==row&&osm.getMatrixColIndex()==col&&osm.getMatrixSelectIndex()==op){
 6                 ocount=osm.getCount();
 7                 break;
 8             }
 9         }
10         double result=(double)ocount/(double)qcount;
11         result=result*100;
12         return (int)result*2+"";
13     }
最后一个问题就是颜色的选取问题,我在Action中定义了一个颜色数组,并且提供了get/set方法,这样在前端就能够直接使用了,文本框的颜色直接使用其option的索引值所在的颜色字符串。
 1 String colors[]={
 2         "aqua",
 3         "black",
 4         "blue",
 5         "fuchsia",
 6         "fuchsia",
 7         "gray",
 8         "green",
 9         "lime",
10         "maroon",
11         "navy",
12         "olive",
13         "orange",
14     };
15     public String[] getColors() {
16         return colors;
17     }
18         public void setColors(String[] colors) {
19         this.colors = colors;
20     }


