使用Mapnik生成地形图——thematicmapping.org译文(四)
原文地址:http://blog.thematicmapping.org/2012/07/terrain-mapping-with-mapnik.html
作者:作者:Bj?rnSandvik(Google Plus:https://plus.google.com/118196887774002693676)
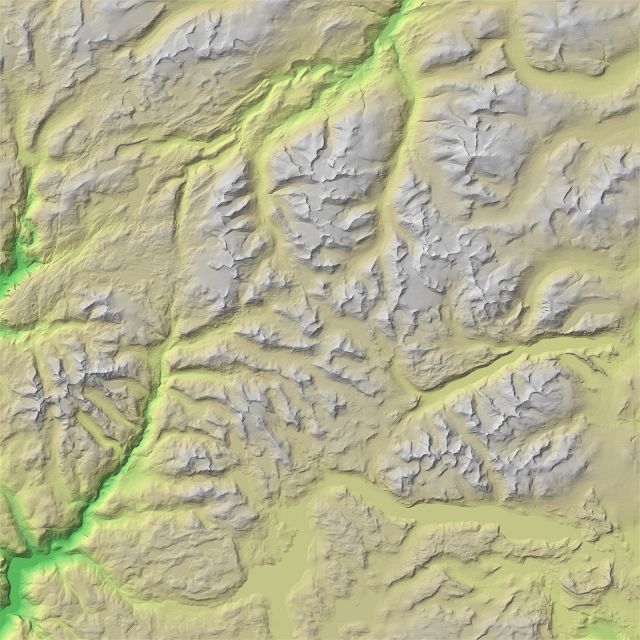
在之前的三篇博文中,我们使用DEM数据分别创建了三个GroTiff的数据,分别是:山体阴影,坡度阴影和彩色地形图,如图1所示。在这篇文章中,我们将把这三个数据合并为一个数据,即Jotunheimen的地形图。
图1 之前三篇博文中生成的三个数据
上面图 1中的三个数据下载地址如下:
- 山体阴影:http://thematicmapping.org/playground/terrain/jotunheimen_hillshade.png
- 坡度阴影:http://thematicmapping.org/playground/terrain/jotunheimen_slopeshade.png
- 彩色地形图:http://thematicmapping.org/playground/terrain/jotunheimen_color_relief.png
Mapnik是一个用于地图渲染和绘制强大的开源工具包。接下来我们将使用RasterSymbolizer来对GeoTiff数据进行合并。样式和图层(影像数据)可以使用xml(jotunheimen_terrain.xml)文件来进行配置,文件内容如下:
<Map srs="+proj=utm +zone=32 +ellps=WGS84 +datum=WGS84 +units=m +no_defs">

  <Style name="color relief style">
    <Rule>
      <RasterSymbolizer mode="normal" />
    </Rule>
  </Style>
  <Style name="hillshade style">
    <Rule>
      <RasterSymbolizer opacity="0.6" mode="multiply" />
    </Rule>
  </Style>

  <Layer name="color relief">
    <StyleName>color relief style</StyleName>
    <Datasource>
      <Parameter name="type">gdal</Parameter>
      <Parameter name="file">jotunheimen_colour_relief.tif</Parameter>
    </Datasource>
  </Layer>
  <Layer name="hillshade">
    <StyleName>hillshade style</StyleName>
    <Datasource>
      <Parameter name="type">gdal</Parameter>
      <Parameter name="file">jotunheimen_hillshade.tif</Parameter>
    </Datasource>
  </Layer>
</Map>
在这个xml文件的第一行,定义了一个地图投影(UTM 32N)。Mapnil使用PROJ.4库,你可以在网站http://spatialreference.org/ref/epsg/32632/proj4/找到这个地图投影对应的PROJ4的格式。Mapnik不能修改图像的投影,所以在使用Mapnik之间把数据都转为所需的投影。
接下来,我定义了此地图的两个风格的RasterSymbolizer。山体阴影来和彩色地形图文件使用乘法混合模式进行混合。山体阴影的每个像素乘以对应的彩色地形图的像素值。同时还设置了山体阴影的不透明度为0.6,减少其的贡献量。接下来是地图图层的样式的定义。Mapnik将按照这个顺序进行渲染,首先从最顶层的图层开始。
你可以使用一个简单的python脚本(jotunheimen_terrain.py)来渲染地图图像(你也可以使用像TileCache和MapProxy工具)。
#!/usr/bin/env python
import mapnik
map = mapnik.Map(3134, 3134)
mapnik.load_map(map, 'jotunheimen_relief.xml')
map.zoom_all()
mapnik.render_to_file(map,'jotunheimen_relief.png')
上面的脚本创建一个PNG图像,使用方法是:
python jotunheimen_terrain.py
得到的结果如下图所示:
接下来,我们在上面的xml中添加坡度阴影数据(jotunheimen_terrain2.xml),改后的xml内容如下:
<Map srs="+proj=utm +zone=32 +ellps=WGS84 +datum=WGS84 +units=m +no_defs">

  <Style name="color relief style">
    <Rule>
      <RasterSymbolizer mode="normal" />
    </Rule>
  </Style>
  <Style name="slopeshade style">
    <Rule>
      <RasterSymbolizer opacity="0.1" mode="multiply" />
    </Rule>
  </Style>
  <Style name="hillshade style">
    <Rule>
      <RasterSymbolizer opacity="0.4" mode="multiply" />
    </Rule>
  </Style>

  <Layer name="color relief">
    <StyleName>color relief style</StyleName>
    <Datasource>
      <Parameter name="type">gdal</Parameter>
      <Parameter name="file">jotunheimen_colour_relief.tif</Parameter>
    </Datasource>
  </Layer>
  <Layer name="slopeshade">
    <StyleName>hillshade style</StyleName>
    <Datasource>
      <Parameter name="type">gdal</Parameter>
      <Parameter name="file">jotunheimen_slopeshade.tif</Parameter>
    </Datasource>
  </Layer>
  <Layer name="hillshade">
    <StyleName>hillshade style</StyleName>
    <Datasource>
      <Parameter name="type">gdal</Parameter>
      <Parameter name="file">jotunheimen_hillshade.tif</Parameter>
    </Datasource>
  </Layer>
</Map>
上面我调整了坡度阴影和山体阴影的透明度来生成新的图像。处理的结果如下图所示:
上面两个图像那个好是完全是由个人的喜好决定的。第一个图中,坡面比较亮,第二个图中,陡峭的山比较明显,而且坡面的细节信息更丰富。
在这两个图中,我很想念Jotunheimen地区的两个重要的地类——湖泊和冰川。在下一个博文中将讨论怎么添加土地覆盖数据。
………………………………………………………分割线……………………………………………………………
关于Bjørn Sandvik系列的博文,暂时翻译这四篇,剩下的不是我关心的,我就不翻译了,有兴趣的童鞋可以去作者的博客看看。有空写个程序,把上面的流程整理一下。


