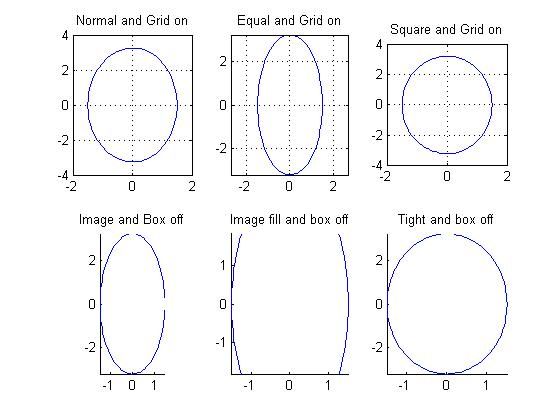
使用MATLAB中axis实现图形坐标控制
Matlab对图形风格的控制比较完备。一方面,在最通用的层面上,采用了一系列考虑周全的默认设置。另一方面,可用户根据需要去自己设置。坐标控制指令axis使用比较简单,用于控制坐标的可视,取向、取值范围和轴的高宽比等。
代码实现程序如下:
clear all;
close all;
clc;

t =0:2*pi/99:2*pi;
x =1.5*cos(t);
y =3.25*sin(t);

subplot(2,3,1),plot(x,y);
axis normal,grid on, title('Normal and Grid on')

subplot(2,3,2),plot(x,y);
axis equal,grid on, title('Equal and Grid on')

subplot(2,3,3),plot(x,y);
axis square,grid on, title('Square and Grid on')

subplot(2,3,4),plot(x,y);
axis image,box off,title('Image and Box off')
subplot(2,3,5),plot(x,y);
axis image fill,box off, title('Image fill and box off')
subplot(2,3,6),plot(x,y);
axis tight,box off, title('Tight and box off')
输出各种轴控制指令的不同影响
关于Image Engineering & Computer Vision的更多讨论与交流,敬请关注本博客和新浪微博songzi_tea.
