ASP.NET Chart 实例 及 解决ChartImg.axd 执行子请求时出错
Chart属性
msdn上Chart属性Chart实例
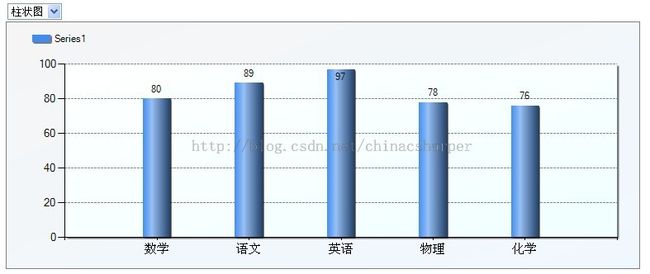
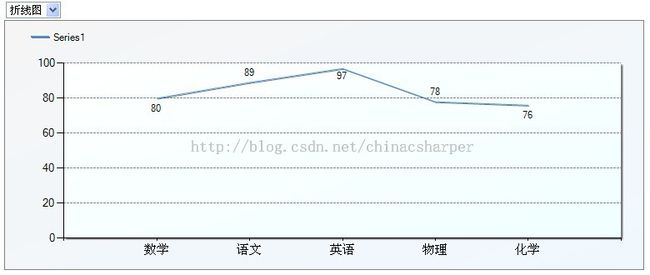
MSChart是VS中自带的图表控件,功能比较强大,效果也比较丰富。下面只提供一个例子,以供新接触的朋友参考。
先看下效果图:
看完效果图上代码啦。
使用这个控件需要先在页面注册一下。
- <%@ Register Assembly="System.Web.DataVisualization, Version=4.0.0.0, Culture=neutral, PublicKeyToken=31bf3856ad364e35"
- Namespace="System.Web.UI.DataVisualization.Charting" TagPrefix="asp" %>
如果你是在VS工具箱中直接拖动的,上述注册控件的代码是可以自动生成的。
- <div>
- <asp:DropDownList ID="ddlSelectType" runat="server" AutoPostBack="true">
- <asp:ListItem Text="柱状图" Value="Column" />
- <asp:ListItem Text="饼图" Value="Pie" />
- <asp:ListItem Text="折线图" Value="Line" />
- </asp:DropDownList>
- <div>
- <asp:Chart ID="Chart1" runat="server" BorderlineDashStyle="Solid" BorderlineColor="Gray"
- Width="768px" BackGradientStyle="DiagonalLeft" BackSecondaryColor="AliceBlue"
- BackColor="WhiteSmoke">
- <Legends>
- <asp:Legend Name="Lgd" BackColor="Transparent" Docking="Top" />
- </Legends>
- <Series>
- <asp:Series Name="Series1" IsValueShownAsLabel="true" CustomProperties="DrawingStyle=Cylinder, MinPixelPointWidth=20, MaxPixelPointWidth=35, PointWidth=0.3"
- IsXValueIndexed="False" ShadowOffset="1" Legend="Lgd" ChartArea="ChartArea1" />
- </Series>
- <ChartAreas>
- <asp:ChartArea Name="ChartArea1" BackColor="White" BackSecondaryColor="Azure" BackGradientStyle="DiagonalLeft"
- ShadowOffset="2">
- <AxisY>
- <MajorGrid LineColor="LightSlateGray" LineDashStyle="Dash" />
- </AxisY>
- <AxisX>
- <MajorGrid Enabled="False" />
- <LabelStyle Font="Microsoft Sans Serif, 8pt" />
- </AxisX>
- </asp:ChartArea>
- </ChartAreas>
- </asp:Chart>
- </div>
- </div>
- protected void Page_Load(object sender, EventArgs e)
- {
- if (!IsPostBack)
- {
- ChartBind(SeriesChartType.Line);
- }
- ddlSelectType.SelectedIndexChanged += new EventHandler(ddlSelectType_SelectedIndexChanged);
- }
- /// <summary>
- /// 准备数据源
- /// </summary>
- /// <returns>数据源</returns>
- public DataTable PrepareData()
- {
- DataTable dt = new DataTable();
- dt.Columns.Add("subject", typeof(string));
- dt.Columns.Add("score", typeof(float));
- dt.Rows.Add("数学", 80);
- dt.Rows.Add("语文", 89);
- dt.Rows.Add("英语", 97);
- dt.Rows.Add("物理", 78);
- dt.Rows.Add("化学", 76);
- return dt;
- }
- /// <summary>
- /// 图表绑定
- /// </summary>
- /// <param name="chartType">图表类型</param>
- public void ChartBind(SeriesChartType chartType)
- {
- DataTable dt = PrepareData();
- Chart1.Series["Series1"].Points.DataBind(dt.DefaultView, "subject", "score", "LegendText=subject,YValues=score,ToolTip=subject");
- Chart1.Series["Series1"].ChartType = chartType;//图表类型
- Chart1.DataBind();
- }
- /// <summary>
- /// 下拉框选择
- /// </summary>
- protected void ddlSelectType_SelectedIndexChanged(object sender, EventArgs e)
- {
- SeriesChartType chartType;
- string value = this.ddlSelectType.SelectedValue;
- switch (value)
- {
- case "Column": chartType = SeriesChartType.Column; break;//柱状图
- case "Pie": chartType = SeriesChartType.Pie; break;//饼图
- case "Line": chartType = SeriesChartType.Line; break;//折线图
- default: chartType = SeriesChartType.Column; break;
- }
- ChartBind(chartType);
- }
值得一提的是,只要指定了图表类别,绑定的代码共用一套,即可显示不同的图表效果。
以上代码源自:http://blog.csdn.net/chinacsharper/article/details/9372377
Chart解决ChartImg.axd 执行子请求时出错
运行报错“ ASP.NET Chart 控件出错 为 ChartImg.axd 执行子请求时出错 ”
网上搜了一下这方面的解决方案,然后结合自己的,最后做了一个小的总结:
一、在vs2008中,你需要按照如下的步骤进行配置:
1、在<configuration>中加入
<system.webServer>
<handlers>
<add name="ChartImageHandler" preCondition="integratedMode" verb="GET,HEAD" path="ChartImg.axd" type="System.Web.UI.DataVisualization.Charting.ChartHttpHandler, System.Web.DataVisualization, Version=3.5.0.0, Culture=neutral, PublicKeyToken=31bf3856ad364e35"/>
</handlers>
</system.webServer>
2、 在<assemblies>中增加(这个应该是会自动生成的)
<add assembly="System.Web.DataVisualization, Version=3.5.0.0, Culture=neutral, PublicKeyToken=31BF3856AD364E35"/>
3、在<system.web>中添加
<httpHandlers>
<add path="ChartImg.axd" verb="GET,HEAD" type="System.Web.UI.DataVisualization.Charting.ChartHttpHandler, System.Web.DataVisualization, Version=3.5.0.0, Culture=neutral, PublicKeyToken=31bf3856ad364e35" validate="false" />
</httpHandlers>
4、在<configuration>中添加
<appSettings>
<add key="ChartImageHandler" value="storage=file;timeout=20;dir=~/TempImages/" />
</appSettings>
二、如果你是在vs2010的4.0下,你就只要在web.config中按照如下的配置就行了:
在<system.web>中添加:
<httpHandlers>
<add path="ChartImg.axd" verb="GET,HEAD,POST" type="System.Web.UI.DataVisualization.Charting.ChartHttpHandler, System.Web.DataVisualization, Version=4.0.0.0, Culture=neutral, PublicKeyToken=31bf3856ad364e35"
validate="false" />
</httpHandlers>
像 <assemblies>
<add assembly="System.Web.DataVisualization, Version=4.0.0.0, Culture=neutral, PublicKeyToken=31BF3856AD364E35"/></assemblies>
这个都会自动生成的,所以就比vs2008要简单些。
上述解决办法来自: http://blog.csdn.net/liu_ben_qian/article/details/7040363
其他博客文章整理的Chart
http://www.cnblogs.com/suguoqiang/archive/2013/01/16/2862945.html
http://www.cnblogs.com/gaoweipeng/archive/2010/04/06/1704879.html
http://www.jq-school.com/Show.aspx?id=311
错误提示修改
http://hi.baidu.com/inspus/item/72cd29aad9985513a8cfb7d1
等等


