TeeChart替代品,MFC下好用的高速绘图控件-(Hight-Speed Charting)
相关链接:
| C++ GUI 绘图控件目录 MFC
Qt
|
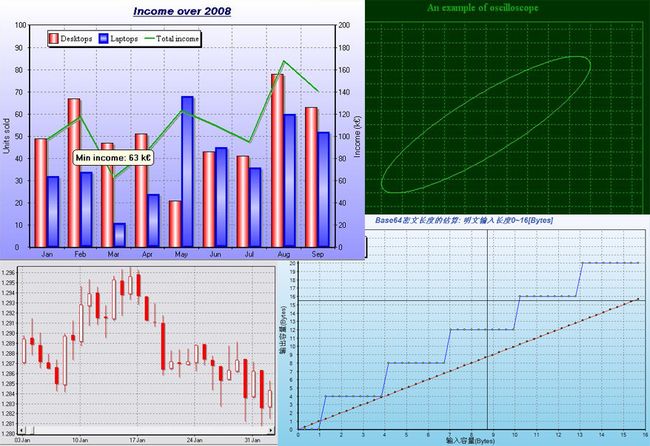
也许这是vc下最好最方便的绘图类,它有TeeChart的绘图和操作风格,不用当心注册破解的问题,因为它是开源的。不用打包注册,因为它是封装成类的,能方便扩展继承。vc6.0到vs2010都能使用,而且非常简单。
此类发表于codeproject
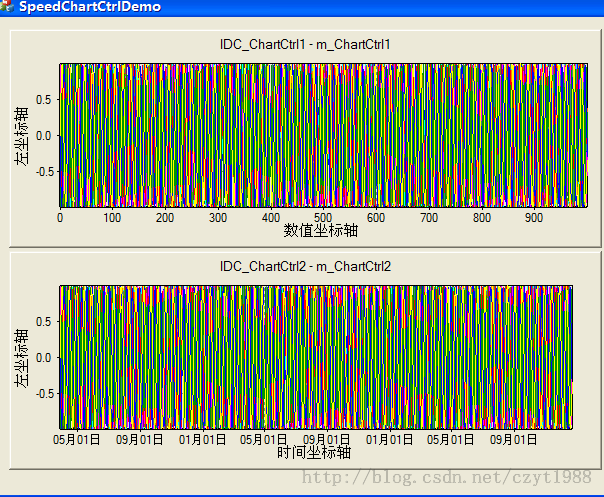
在使用它的时候,展示一下它的效果吧:
如果你想需要上面这些效果的,果断选它吧!
下面用图文并茂的方式,来详细介绍这个绘图控件
首先,下载这个控件,最新可以从这里获取codeproject
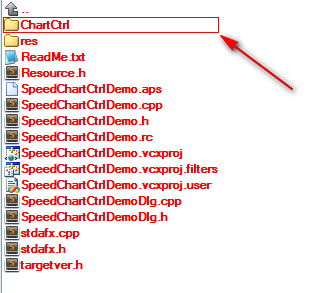
1 ChartCtrl类的导入
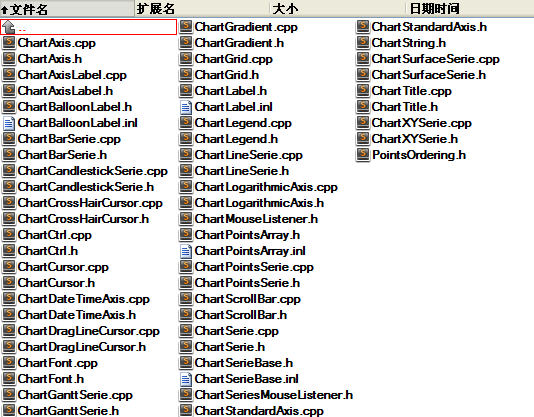
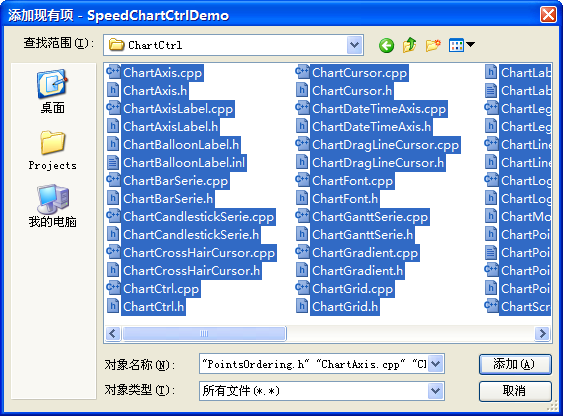
文件夹内容如图所示

2.创建控件
2.1 对话框编辑器创建
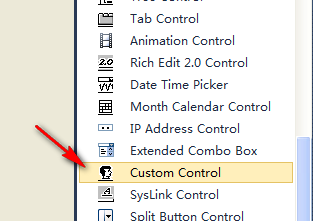
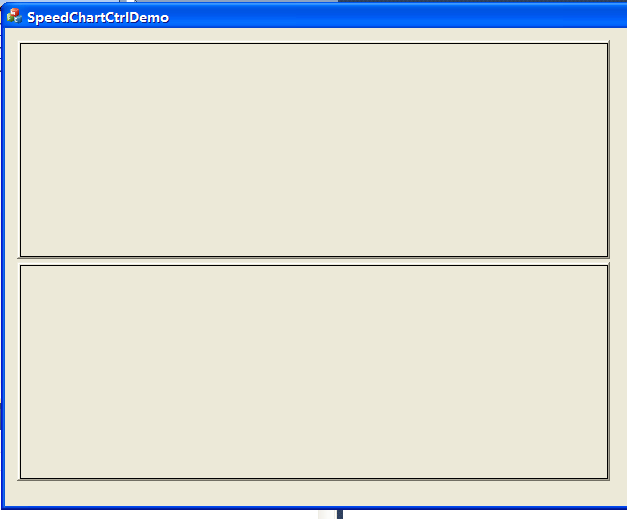
对于一些不需要改变大小的对话框来说,在对话框编辑器里拖曳创建控件是最舒服的方法了,这个ChartCtrl可以用用户控件来创建首先在对话框上放置一个Custom Control
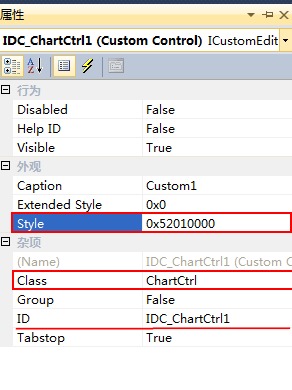
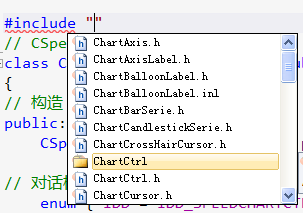
给对话框添加变量,和传统的方法一样。这里需要注意的是,由于文件都放置在工程文件的一个文件夹下,包含头文件时需要指明路径
#include "ChartCtrl/ChartCtrl.h"
CChartCtrl m_ChartCtrl2;
void CSpeedChartCtrlDemoDlg::DoDataExchange(CDataExchange* pDX)
{
    CDialogEx::DoDataExchange(pDX);
    DDX_Control(pDX, IDC_ChartCtrl1, m_ChartCtrl1);
}
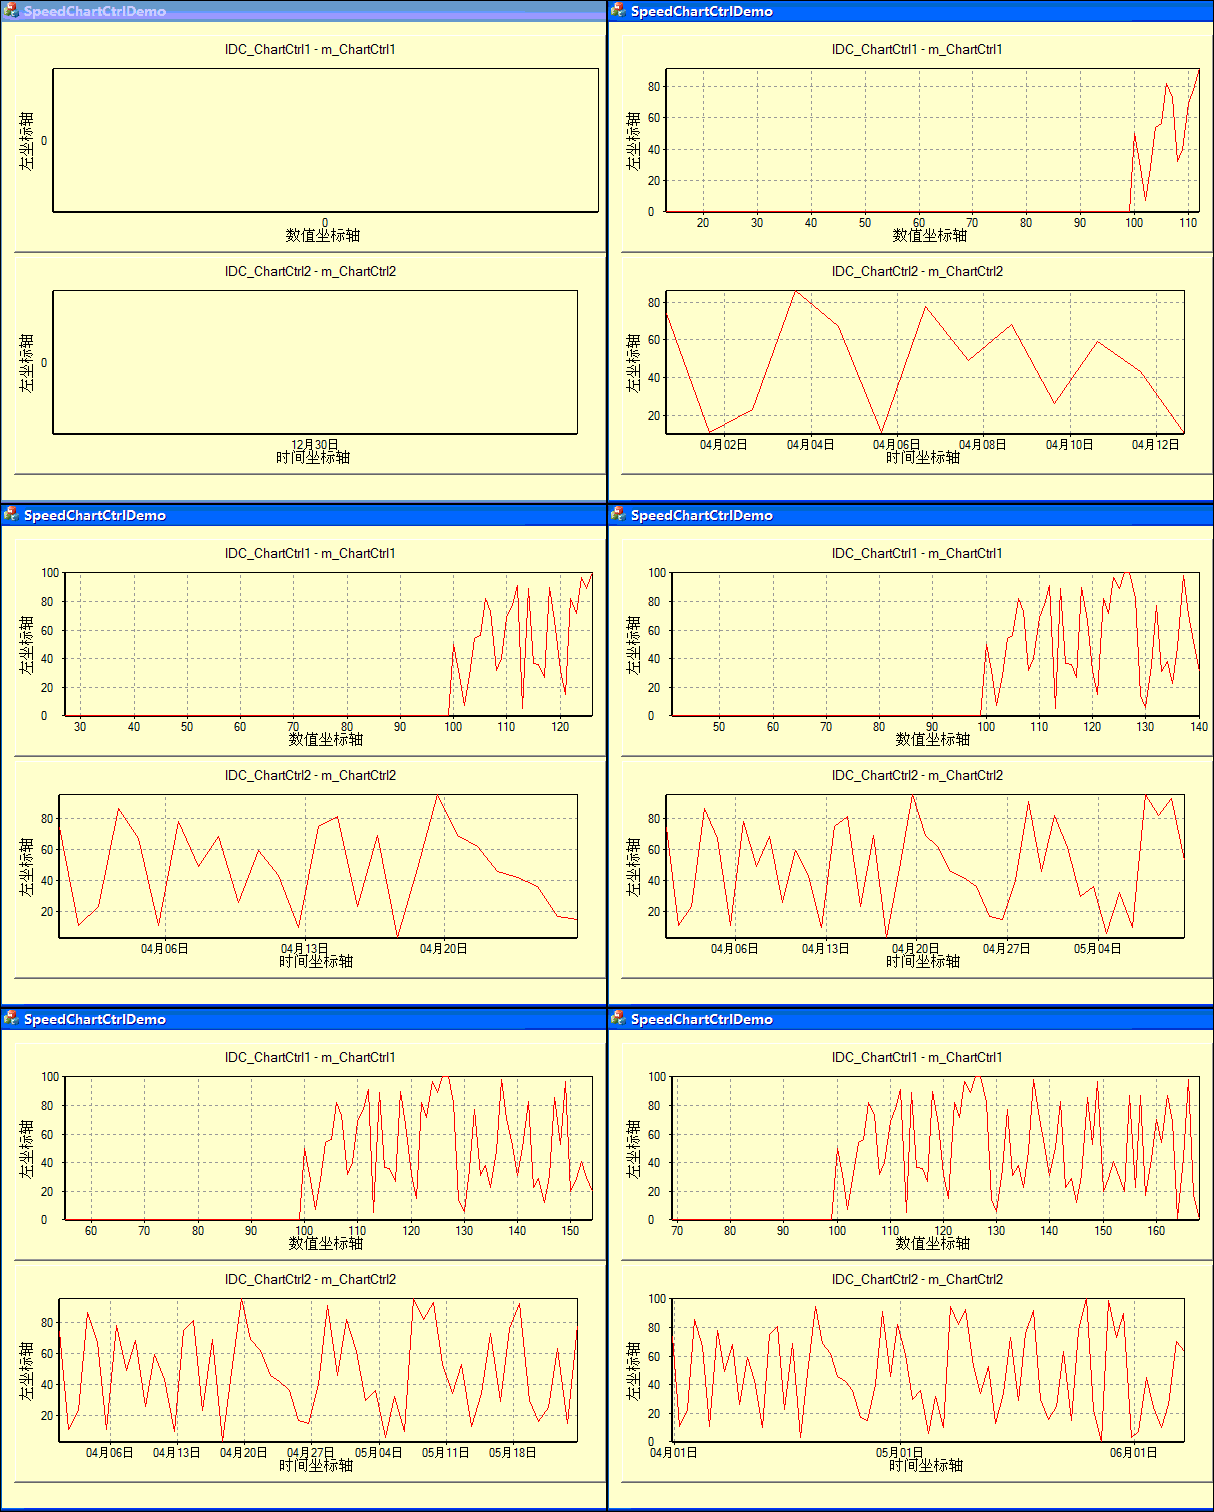
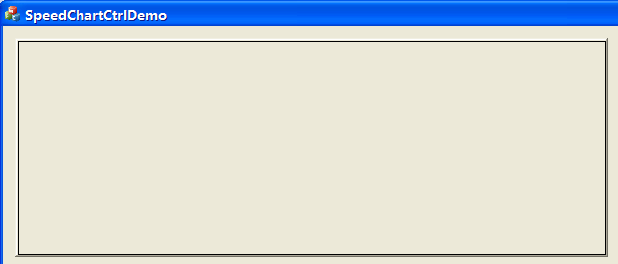
编译运行,绘图控件就出来了
2.2 动态创建
#include "ChartCtrl/ChartCtrl.h"然后添加成员变量
CChartCtrl m_ChartCtrl2;
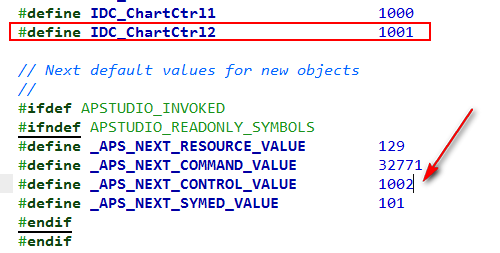
添加IDC_ChartCtrl2,为1001,注意记得把_APS_NEXT_CONTROL_VALUE改成下一个资源号
在OnInitDialog里创建
CRect rect,rectChart;
GetDlgItem(IDC_ChartCtrl1)->GetWindowRect(&rect);
ScreenToClient(rect);
rectChart = rect;
rectChart.top = rect.bottom + 3;
rectChart.bottom = rectChart.top + rect.Height();
m_ChartCtrl2.Create(this,rectChart,IDC_ChartCtrl2);
m_ChartCtrl2.ShowWindow(SW_SHOWNORMAL);
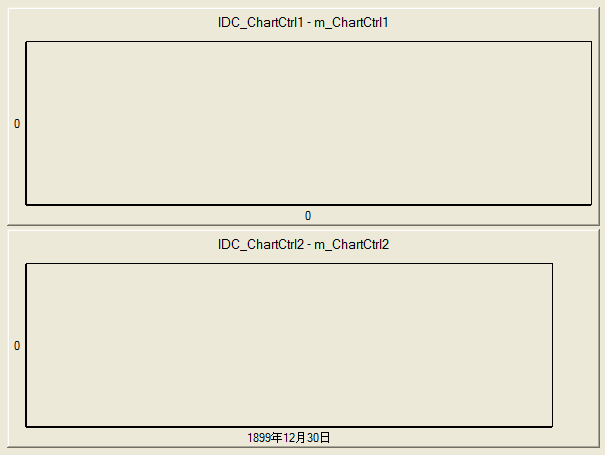
这样就可以创建了,下图两个控件分别通过对话框编辑器创建和动态创建,代码在附件下载里
此时什么也不会显示,需要添加坐标轴
3.创建坐标轴
CChartAxis *pAxis= NULL;
pAxis = m_ChartCtrl1.CreateStandardAxis(CChartCtrl::BottomAxis);
pAxis->SetAutomatic(true);
pAxis = m_ChartCtrl1.CreateStandardAxis(CChartCtrl::LeftAxis);
pAxis->SetAutomatic(true);
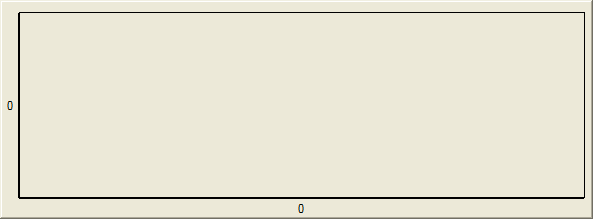
这样就建立两个坐标轴了,如图所示
CChartDateTimeAxis* pDateAxis= NULL;
pDateAxis = NULL;
pDateAxis = m_ChartCtrl2.CreateDateTimeAxis(CChartCtrl::BottomAxis);
pDateAxis->SetAutomatic(true);
pDateAxis->SetTickLabelFormat(false,_T("%m月%d日"));
pAxis = m_ChartCtrl2.CreateStandardAxis(CChartCtrl::LeftAxis);
pAxis->SetAutomatic(true);
4.创建标题
在添加标题时,先要说说ChartCtrl的字符串,ChartCtrl的字符串实际是stl的string和wstring,为了对应unicode,作者对这两种字符进行了一个宏定义,就像TCHAR一样,定义如下:
#include<string>
#include <sstream>

#if defined _UNICODE ||defined UNICODE
    typedef std::wstring TChartString;
    typedef std::wstringstream TChartStringStream;
#else
    typedef std::string TChartString;
    typedef std::stringstream TChartStringStream;
#endif
所以在多字节情况下,就是string。由于MFC大部分都是用CString,CString也是经过宏定义,所以可以比较轻松的和TChartString转换,另外TChartStringStream远比CString的Format灵活和直观,建议大家研究研究!
加入如下代码:
TChartString str1;
str1 = _T("IDC_ChartCtrl1 - m_ChartCtrl1");
m_ChartCtrl1.GetTitle()->AddString(str1);

CString str2(_T(""));
str2 = _T("IDC_ChartCtrl2 - m_ChartCtrl2");
m_ChartCtrl2.GetTitle()->AddString(TChartString(str2));
TChartString 可以直接用“=”对字符串赋值
设置坐标轴的标题,首先需要获取坐标GetLeftAxis,GetBottomAxis ……
获取坐标后,获得坐标的文字标签GetLabel,然后进行修改
如下两种写法,一种比较安全繁琐,一种就直接过去就可以,看个人喜好
CChartAxisLabel* pLabel = NULL;
CChartAxis *pAxis = NULL;
TChartString str1 = _T("左坐标轴");

CChartAxisLabel* pLabel = NULL;

pAxis = m_ChartCtrl1.GetLeftAxis();
if(pAxis)
    pLabel = pAxis->GetLabel();
if(pLabel)
    pLabel->SetText(str1);

m_ChartCtrl2.GetLeftAxis()->GetLabel()->SetText(str1);

str1 = _T("数值坐标轴");
pAxis = m_ChartCtrl1.GetBottomAxis();
if(pAxis)
    pLabel = pAxis->GetLabel();
if(pLabel)
    pLabel->SetText(str1);
str1 = _T("时间坐标轴");

m_ChartCtrl2.GetBottomAxis()->GetLabel()->SetText(str1);
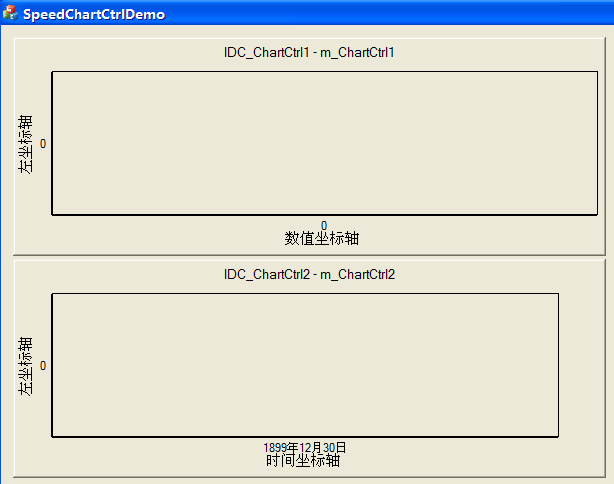
设置完效果如图
标题还可以更改颜色,这里不再重复描述。
5.画图
5.1 创建线图
m_ChartCtrl1.EnableRefresh(false);
m_ChartCtrl2.EnableRefresh(false);
//////////////////////////////////////////////////////////////////////////
//画图测试
//////////////////////////////////////////////////////////////////////////
double x[1000], y[1000];
for (int i=0; i<1000; i++)
{
    x[i] = i;
    y[i] = sin(float(i));
}
CChartLineSerie *pLineSerie1;
m_ChartCtrl1.RemoveAllSeries();//先清空
pLineSerie1 = m_ChartCtrl1.CreateLineSerie();
pLineSerie1->SetSeriesOrdering(poNoOrdering);//设置为无序
pLineSerie1->AddPoints(x, y,1000);
pLineSerie1->SetName(_T("这是IDC_ChartCtrl1的第一条线"));//SetName的作用将在后面讲到

//////////////////////////////////////////////////////////////////////////
//时间轴画图
//////////////////////////////////////////////////////////////////////////
COleDateTime t1(COleDateTime::GetCurrentTime());
COleDateTimeSpan tsp(1,0,0,0);
for (int i=0; i<1000; i++)
{
    x[i] = t1.m_dt;
    y[i] = sin(float(i));
    t1 += tsp;
}
CChartLineSerie *pLineSerie2;
m_ChartCtrl2.RemoveAllSeries();//先清空
pLineSerie2 = m_ChartCtrl2.CreateLineSerie();
pLineSerie2->SetSeriesOrdering(poNoOrdering);//设置为无序
pLineSerie2->AddPoints(x, y,1000);
pLineSerie2->SetName(_T("这是IDC_ChartCtrl2的第一条线"));//SetName的作用将在后面讲到

m_ChartCtrl1.EnableRefresh(true);
m_ChartCtrl2.EnableRefresh(true);
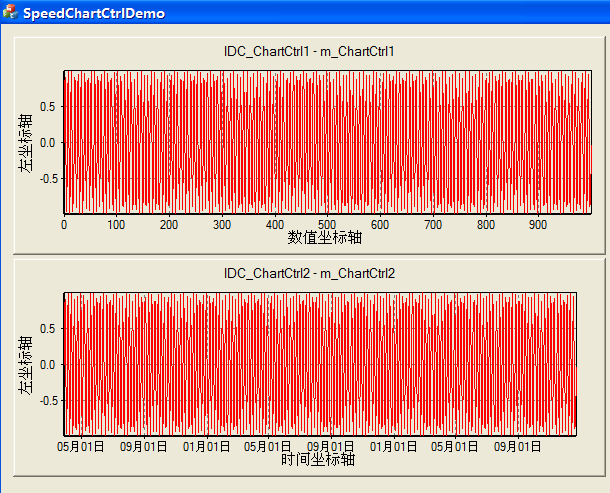
5.2 添加曲线
m_ChartCtrl1.EnableRefresh(false);
m_ChartCtrl2.EnableRefresh(false);
//////////////////////////////////////////////////////////////////////////
//画图测试
//////////////////////////////////////////////////////////////////////////
double x[1000], y[1000];
for (int i=0; i<1000; i++)
{
x[i] = i;
y[i] = sin(float(i)*m_ChartCtrl1.GetSeriesCount());
}
CChartLineSerie *pLineSerie1;
// m_ChartCtrl1.RemoveAllSeries();//不清空
pLineSerie1 = m_ChartCtrl1.CreateLineSerie();
pLineSerie1->SetSeriesOrdering(poNoOrdering);//设置为无序
pLineSerie1->AddPoints(x, y,1000);
TChartStringStream strs1;
strs1 << _T("这是IDC_ChartCtrl1的第")
<< m_ChartCtrl1.GetSeriesCount()
<< _T("条曲线");
pLineSerie1->SetName(strs1.str());

//////////////////////////////////////////////////////////////////////////
//时间轴画图
//////////////////////////////////////////////////////////////////////////
COleDateTime t1(COleDateTime::GetCurrentTime());
COleDateTimeSpan tsp(1,0,0,0);
for (int i=0; i<1000; i++)
{
x[i] = t1.m_dt;
y[i] = sin(float(i)*m_ChartCtrl2.GetSeriesCount());
t1 += tsp;
}
CChartLineSerie *pLineSerie2;
// m_ChartCtrl2.RemoveAllSeries();//不清空
pLineSerie2 = m_ChartCtrl2.CreateLineSerie();
pLineSerie2->SetSeriesOrdering(poNoOrdering);//设置为无序
pLineSerie2->AddPoints(x, y,1000);
TChartStringStream strs2;
strs2 << _T("这是IDC_ChartCtrl2的第")
<< m_ChartCtrl2.GetSeriesCount()
<< _T("条曲线");
pLineSerie2->SetName(strs2.str());

m_ChartCtrl1.EnableRefresh(true);
m_ChartCtrl2.EnableRefresh(true);
5.3 动态曲线
for(int i(0);i<99;++i)
{
   pdx[i] = pdx[i+1];
   pdy[i] = pdy[i+1];
}
pdy[99] = ……需要显示的新数据……
ChartCtrl提供了两种绘图函数,AddPoints和AddPoint,这两种函数在绘制动态图时会有所区别,区别见上图,上面的是AddPoints,绘图长度固定,AddPoint效果见下图,图线会不停积累。
这是我在上研究生时写的一篇文章,当时放进草稿箱里一直没发出来,今天无意看到,决定把他完成,demo代码已经找不到了,可能在我以前实验室的电脑里吧~工作后也很少用mfc了,现在偶尔用用qt过把瘾,大家如果对绘图工控有需求的话,可以使用qt的qwt控件,也比较简单,这个控件帮了我很多忙,在此向作者表示感谢,大家可以查看其源代码学习其编程思想。
下载地址:http://www.codeproject.com/Articles/14075/High-speed-Charting-Control
csdn资源下载地址:http://download.csdn.net/detail/czyt1988/6880917
| C++ GUI 绘图控件目录 MFC
Qt
|
推广
| teechart应用技术详解——快速图表制作工具 | VC++ MFC Extensions by Example/J.E. Swanke | C++ Primer Plus 第6版 |
 |
 |
 |
