用Qt绘制柱状图
用Qt绘制柱状图
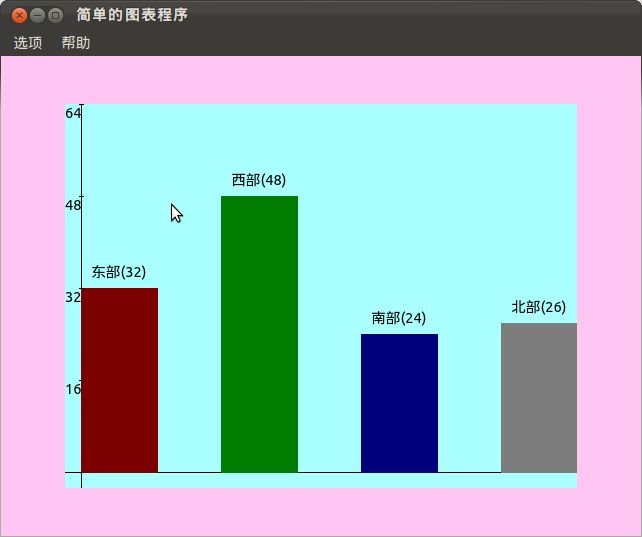
最近复习已经学习的Qt知识,制作了一个简单的图表显示工具。目前它能够很好地显示柱状图,其效果如下所示:
这个柱状图支持任意多的项目(柱子),只需要在代码中添加了相关数据后,使用Paint()函数就可以将其渲染成一个Pixmap,然后作为中央控件(centeralwidget)的一张图片显示出来。下面是源代码的下载地址:这里
如果对程序的实现感兴趣,那么看看我写的相关类吧。
#ifndef HISTOGRAM_H
#define HISTOGRAM_H
// Histogram.h 柱状图类的声明
// 名词解释:Histogram 柱状图
// pillar 柱子
#include <QVector>
// 前向声明
QT_BEGIN_NAMESPACE
class QColor;
class QRect;
class QString;
class QPaintDevice;
QT_END_NAMESPACE
class HistogramItem
{
public:
        QString m_Name;
        qreal m_Value;
        QColor m_PillarColor;
        QRect m_PillarRect;
};
class Histogram
{
public:
        Histogram( void );
        void AddItem( QString name, qreal value,
                                  QColor pillarColor );
        void SetMaxValue( quint32 maxValue ); // 设置最大值,以便绘图
        void Paint( QPaintDevice* pDevice ); // 绘图
private:
        void DrawAxis( QPaintDevice* pDevice, QPainter* pPainter );
        void DrawPillars( QPaintDevice* pDevice, QPainter* pPainter ); // 绘制柱子
        void DrawText( QPainter *pPainter ); // 绘制文字
        void DrawScale( QPaintDevice* pDevice, QPainter* pPainter ); // 绘制刻度
        enum HistogramOptions
        {
                blankWidth = 64, // 两个柱子间的空格大小
                pillarIndent = 0, // 首个柱子缩进的大小
                xAxisOffset = 16, // X轴的偏移(相对于左边界)
                yAxisOffset = 16, // Y轴的偏移(相对于下边界)
                textRectHeight = 32 // 文字矩形框的高
        };
        qreal m_MaxValue;
        QVector<HistogramItem> m_VecItems;
};
#endif // HISTOGRAM_H
其中的HistogramOptions是该图表的外观选项,通过修改其中的值,可以对图表的外观进行一些微调。
下面是Histogram.cpp,是对Histogram类的实现。
#include <QtGui>
#include "Histogram.h"
Histogram::Histogram( void )
{
        m_VecItems.clear( );
}
void Histogram::AddItem( QString name, qreal value,
                                                 QColor pillarColor )
{
        HistogramItem item;
        item.m_Name = name;
        item.m_Value = value;
        item.m_PillarColor = pillarColor;
        item.m_PillarRect = QRect( );
        m_VecItems.push_back( item );
}
void Histogram::SetMaxValue( quint32 maxValue )
{
        m_MaxValue = maxValue;
}
void Histogram::Paint( QPaintDevice* pDevice )
{
        QPainter painter( pDevice );
        DrawAxis( pDevice, &painter );
        DrawPillars( pDevice, &painter );
        DrawText( &painter );
        DrawScale( pDevice, &painter );
}
void Histogram::DrawAxis( QPaintDevice* pDevice, QPainter* pPainter )
{
        pPainter->drawLine( yAxisOffset, 0, yAxisOffset, pDevice->height( ) );
        pPainter->drawLine( 0, pDevice->height( ) - xAxisOffset,
                                                pDevice->width( ), pDevice->height( ) - xAxisOffset );
}
void Histogram::DrawPillars( QPaintDevice* pDevice, QPainter* pPainter ) // 绘制柱子
{
        if ( m_VecItems.size( ) == 0 ) return;
        //const quint32 blankWidth = 64; // 柱子间空格宽
        quint32 pillarWidth = ( pDevice->width( ) - yAxisOffset - pillarIndent
                                                        - quint32( m_VecItems.size( ) - 1 ) * blankWidth )
                        / m_VecItems.size( ); // 柱子的宽
        // 绘制因子。绘制因子在绘制柱子的时候起着重要作用。
        // 根据比例公式:
        // pDevice->width( ) - xAxisOffset pillarHeight
        // --------------------------------- = --------------------
        // MaxValue m_VecItem[0].value
        // 求出pillarHeight的值,但是左边的部分我们可以看作是一个绘制因子heightFact记录下来。
        // 计算时可以节约时间。
        qreal heightFact = qreal( pDevice->height( ) - xAxisOffset ) / m_MaxValue;
        for ( int i = 0; i < m_VecItems.size( ); ++i )
        {
                quint32 pillarHeight = m_VecItems[i].m_Value * heightFact;
                int leftUpX = yAxisOffset + pillarIndent + i * ( pillarWidth + blankWidth );
                int leftUpY = pDevice->height( ) - xAxisOffset - pillarHeight;
                QRect& rect = m_VecItems[i].m_PillarRect;
                rect.setRect( leftUpX, leftUpY, pillarWidth, pillarHeight );
                pPainter->setPen( QPen( m_VecItems[i].m_PillarColor ) );
                pPainter->setBrush( QBrush( m_VecItems[i].m_PillarColor ) );
                pPainter->drawRect( rect );
        }
}
void Histogram::DrawText( QPainter* pPainter ) // 绘制文字
{
        // 已经可以保证m_VecItems.[i].m_Rect.isNull( )为假
        // 即柱子所在的矩形框是一个有效的矩形框
        pPainter->setPen( QPen( QColor( 0, 0, 0 ) ) );
        for ( int i = 0; i < m_VecItems.size( ); ++i )
        {
                QRect rect( m_VecItems[i].m_PillarRect.left( ) - blankWidth / 2,
                                        m_VecItems[i].m_PillarRect.top( ) - textRectHeight,
                                        m_VecItems[i].m_PillarRect.width( ) + blankWidth,
                                        textRectHeight );
                const QString& text = QString( "%1(%2)" )
                                .arg( m_VecItems[i].m_Name ).arg( m_VecItems[i].m_Value );
                pPainter->drawText( rect, Qt::AlignCenter, text );
        }
}
void Histogram::DrawScale( QPaintDevice *pDevice, QPainter *pPainter ) // 绘制刻度
{
        // 名词解释 MSWidth = Marked Scale Width,刻度宽
        // MSHeight = Marked Scale Height 刻度高
        const quint32 MSWidth = 100;
        const quint32 MSHeight = textRectHeight;
        const quint32 heightInterval
                        = ( pDevice->height( ) - xAxisOffset ) / 4;
        for ( int i = 0; i < 4; ++i )
        {
                QRect rect( 0,
                                        i * heightInterval,
                                        MSWidth,
                                        MSHeight );
                pPainter->drawLine( yAxisOffset - 2,
                                                        i * heightInterval,
                                                        yAxisOffset + 2,
                                                        i * heightInterval );
                pPainter->drawText(
                                        rect, Qt::AlignLeft, QString( "%1" )
                                        .arg( m_MaxValue * ( 4 - i ) / 4 ) );
        }
}
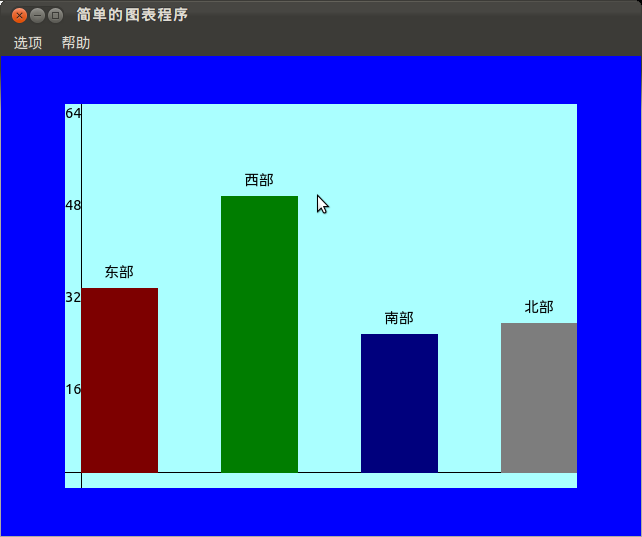
柱状图以前的各个版本:


