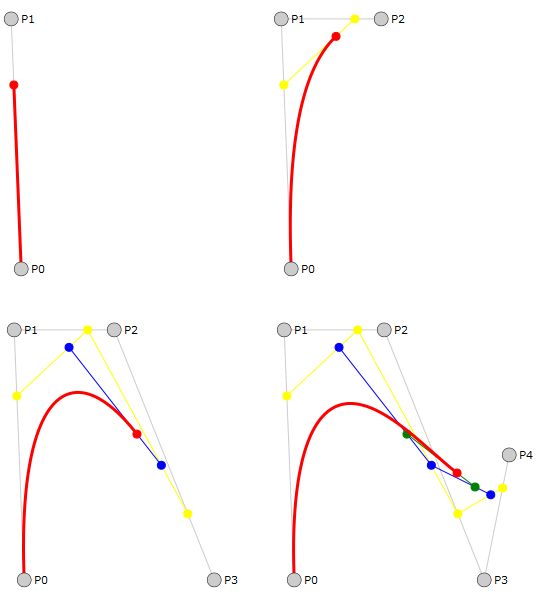
SVG动画演示贝塞尔曲线(1-4阶)绘制过程
贝塞尔曲线是我们大陆的叫法,英文名是Bézier Curve,港澳台称为貝茲曲線,新加坡马来西亚称为贝济埃曲线。
先看一下效果图: 点击这里查看动画效果
维基百科中的贝塞尔曲线条目中的几个GIF动画很漂亮,顺路贴上来。
核心Javscript代码:
var w = 250,
    h = 300,
    t = .5,
    delta = .01,
    padding = 10,
    points = [{x: 10, y: 250}, {x: 0, y: 0}, {x: 100, y: 0}, {x: 200, y: 250}, {x: 225, y: 125}],
    bezier = {},
    line = d3.svg.line().x(x).y(y),
    n = 4,
    orders = d3.range(2, n + 2);

var vis = d3.select("body").selectAll("svg")
    .data(orders)
  .enter().append("svg:svg")
    .attr("width", w + 2 * padding)
    .attr("height", h + 2 * padding)
  .append("svg:g")
    .attr("transform", "translate(" + padding + "," + padding + ")");

update();

vis.selectAll("circle.control")
    .data(function(d) { return points.slice(0, d) })
  .enter().append("svg:circle")
    .attr("class", "control")
    .attr("r", 7)
    .attr("cx", x)
    .attr("cy", y)
    .call(d3.behavior.drag()
      .on("dragstart", function(d) {
        this.__origin__ = [d.x, d.y];
      })
      .on("drag", function(d) {
        d.x = Math.min(w, Math.max(0, this.__origin__[0] += d3.event.dx));
        d.y = Math.min(h, Math.max(0, this.__origin__[1] += d3.event.dy));
        bezier = {};
        update();
        vis.selectAll("circle.control")
          .attr("cx", x)
          .attr("cy", y);
      })
      .on("dragend", function() {
        delete this.__origin__;
      }));

vis.append("svg:text")
  .attr("class", "t")
  .attr("x", w / 2)
  .attr("y", h)
  .attr("text-anchor", "middle");

vis.selectAll("text.controltext")
    .data(function(d) { return points.slice(0, d); })
  .enter().append("svg:text")
    .attr("class", "controltext")
    .attr("dx", "10px")
    .attr("dy", ".4em")
    .text(function(d, i) { return "P" + i });

var last = 0;
d3.timer(function(elapsed) {
  t = (t + (elapsed - last) / 5000) % 1;
  last = elapsed;
  update();
});

function update() {
  var interpolation = vis.selectAll("g")
      .data(function(d) { return getLevels(d, t); });
  interpolation.enter().append("svg:g")
      .style("fill", colour)
      .style("stroke", colour);

  var circle = interpolation.selectAll("circle")
      .data(Object);
  circle.enter().append("svg:circle")
      .attr("r", 4);
  circle
      .attr("cx", x)
      .attr("cy", y);

  var path = interpolation.selectAll("path")
      .data(function(d) { return [d]; });
  path.enter().append("svg:path")
      .attr("class", "line")
      .attr("d", line);
  path.attr("d", line);

  var curve = vis.selectAll("path.curve")
      .data(getCurve);
  curve.enter().append("svg:path")
      .attr("class", "curve");
  curve.attr("d", line);

  vis.selectAll("text.controltext")
      .attr("x", x)
      .attr("y", y);
  vis.selectAll("text.t")
      .text("t=" + t.toFixed(2));
}

function interpolate(d, p) {
  if (arguments.length < 2) p = t;
  var r = [];
  for (var i=1; i<d.length; i++) {
    var d0 = d[i-1], d1 = d[i];
    r.push({x: d0.x + (d1.x - d0.x) * p, y: d0.y + (d1.y - d0.y) * p});
  }
  return r;
}

function getLevels(d, t_) {
  if (arguments.length < 2) t_ = t;
  var x = [points.slice(0, d)];
  for (var i=1; i<d; i++) {
    x.push(interpolate(x[x.length-1], t_));
  }
  return x;
}

function getCurve(d) {
  var curve = bezier[d];
  if (!curve) {
    curve = bezier[d] = [];
    for (var t_=0; t_<=1; t_+=delta) {
      var x = getLevels(d, t_);
      curve.push(x[x.length-1][0]);
    }
  }
  return [curve.slice(0, t / delta + 1)];
}

function x(d) { return d.x; }
function y(d) { return d.y; }
function colour(d, i) {
  return d.length > 1 ? ["#ccc", "yellow", "blue", "green"][i] : "red";
}
