Debug / Inspect WebSocket traffic with Fiddler
Introduction
I have recently written a project using SignalR, which supports HTML 5 WebSocket. However I cannot find good tools to debug or inspect WebSocket traffic. I know that both Chrome and Fiddler support inspecting the WebSocket traffic, but they are very basic. If you have very high volume of traffic or each frame is very large, it becomes very difficult to use them for debugging. (Please see more details in the Background section).
I am going to show you how to use Fiddler (and FiddlerScript) to inspect WebSocket traffic in the same way you inspect HTTP traffic. This technique applies to all WebSocket implementations including SignalR, Socket.IO and raw WebSocket implementation, etc.
Background
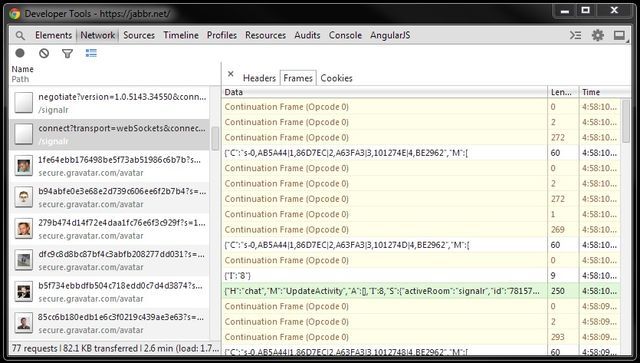
Limit of Chrome traffic inspector:
- WebSocket traffic is shown in Network tab -> "connect" packet (101 Switching Protocols) -> Frame tab. WebSocket traffic does not automatically refresh unless you click on the 101 packet again.
- It does not support "Continuation Frame", as shown below:
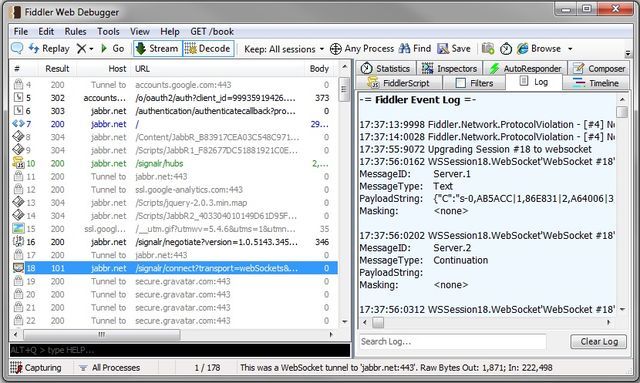
Limit of Fiddler Log tab:
- WebSocket traffic frames in the Fiddler Log tab are not grouped, therefore it is hard to navigate between frames.
- Continuation frames are not decoded, they are displayed as binary.
- In addition, if you have very high volume of traffic, Fiddler will use up 100% of your CPU and hang.
- Hint: Fiddler no longer spews WebSocket messages to the Log tab by default.
You can do so using FiddlerScript. Simply click Rules > Customize
Rules and add the following function inside your Handlers class:
static function OnWebSocketMessage(oMsg: WebSocketMessage) { // Log Message to the LOG tab FiddlerApplication.Log.LogString(oMsg.ToString()); }
Solution
With this solution, you get all following benefits:
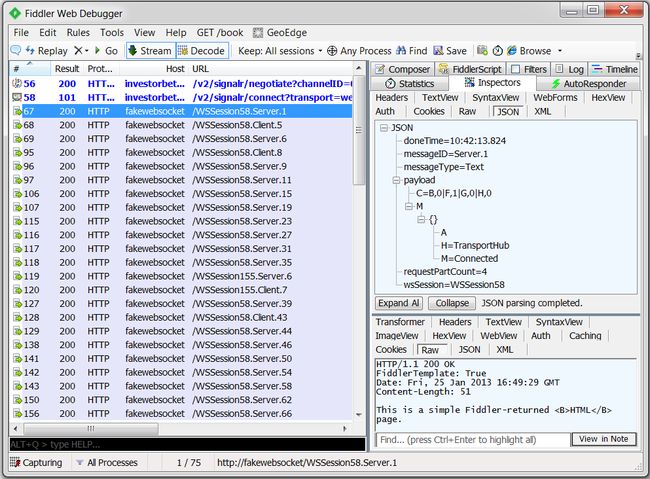
- You can see all WebSocket frames in Fiddler main window, and you can navigate between frames easily.
- You can see the frame details in the Inspector tab -> Request info -> JSON sub-tab.
- Continuation frames are automatically decoded and combined together.
- All frames are captured and displayed in Fiddler main window automatically without manual reload.
- CPU usage for Fiddler will still be low for high volume of traffic.
How it works?
1. Download Fiddler Web Debugger (v4.4.5.9)
2. Open Fiddler -> Rules -> Customize Rules... ->This will open the FiddlerScript
3. Add following codes FiddlerScript:
Hide ShrinkCopy Code
import System.Threading;

// ... class Handlers { // ... static function Main() { // ... // // Print Web Socket frame every 2 seconds // printSocketTimer = new System.Threading.Timer(PrintSocketMessage, null, 0, 2000); } // Create a first-in, first-out queue static var socketMessages = new System.Collections.Queue(); static var printSocketTimer = null; static var requestBodyBuilder = new System.Text.StringBuilder(); static var requestUrlBuilder = new System.Text.StringBuilder(); static var requestPayloadIsJson = false; static var requestPartCount = 0; // // Listen to WebSocketMessage event, and add the socket messages // to the static queue. // static function OnWebSocketMessage(oMsg: WebSocketMessage) { Monitor.Enter(socketMessages); socketMessages.Enqueue(oMsg); Monitor.Exit(socketMessages); } // // Take socket messages from the static queue, and generate fake // HTTP requests that will be caught by Fiddler. // static function PrintSocketMessage(stateInfo: Object) { Monitor.Enter(socketMessages); while (socketMessages.Count > 0) { var oMsg = socketMessages.Dequeue(); ExtractSocketMessage(oMsg); } Monitor.Exit(socketMessages); } // // Build web socket message information in JSON format, and send this JSON // information in a fake HTTP request that will be caught by Fiddler // // If a frame is split in multiple messages, following function will combine // them into one // static function ExtractSocketMessage(oMsg: WebSocketMessage) { if (oMsg.FrameType != WebSocketFrameTypes.Continuation) { var messageID = String.Format( "{0}.{1}", oMsg.IsOutbound ? "Client" : "Server", oMsg.ID); var wsSession = GetWsSession(oMsg); requestUrlBuilder.AppendFormat("{0}.{1}", wsSession, messageID); requestBodyBuilder.Append("{"); requestBodyBuilder.AppendFormat("\"doneTime\": \"{0}\",", oMsg.Timers.dtDoneRead.ToString("hh:mm:ss.fff")); requestBodyBuilder.AppendFormat("\"messageType\": \"{0}\",", oMsg.FrameType); requestBodyBuilder.AppendFormat("\"messageID\": \"{0}\",", messageID); requestBodyBuilder.AppendFormat("\"wsSession\": \"{0}\",", wsSession); requestBodyBuilder.Append("\"payload\": "); var payloadString = oMsg.PayloadAsString(); if (oMsg.FrameType == WebSocketFrameTypes.Binary) { payloadString = HexToString(payloadString); } if (payloadString.StartsWith("{")) { requestPayloadIsJson = true; } else { requestBodyBuilder.Append("\""); } requestBodyBuilder.AppendFormat("{0}", payloadString); } else { var payloadString = HexToString(oMsg.PayloadAsString()); requestBodyBuilder.AppendFormat("{0}", payloadString); } requestPartCount++; if (oMsg.IsFinalFrame) { if (!requestPayloadIsJson) { requestBodyBuilder.Append("\""); } requestBodyBuilder.AppendFormat(", \"requestPartCount\": \"{0}\"", requestPartCount); requestBodyBuilder.Append("}"); SendRequest(requestUrlBuilder.ToString(), requestBodyBuilder.ToString()); requestBodyBuilder.Clear(); requestUrlBuilder.Clear(); requestPayloadIsJson = false; requestPartCount = 0; } } // // Generate fake HTTP request with JSON data that will be caught by Fiddler // We can inspect this request in "Inspectors" tab -> "JSON" sub-tab // static function SendRequest(urlPath: String, message: String) { var request = String.Format( "POST http://fakewebsocket/{0} HTTP/1.1\n" + "User-Agent: Fiddler\n" + "Content-Type: application/json; charset=utf-8\n" + "Host: fakewebsocket\n" + "Content-Length: {1}\n\n{2}", urlPath, message.Length, message); FiddlerApplication.oProxy.SendRequest(request, null); } // // Unfortunately, WebSocketMessage class does not have a member for // Web Socket session number. Therefore, we are extracting session number // from its string output. // static function GetWsSession(oMsg: WebSocketMessage) { var message = oMsg.ToString(); var index = message.IndexOf("."); var wsSession = message.Substring(0, index); return wsSession; } // // Extract Hex to String. // E.g., 7B-22-48-22-3A-22-54-72-61-6E to {"H":"TransportHub","M":" // static function HexToString(sourceHex: String) { sourceHex = sourceHex.Replace("-", ""); var sb = new System.Text.StringBuilder(); for (var i = 0; i < sourceHex.Length; i += 2) { var hs = sourceHex.Substring(i, 2); sb.Append(Convert.ToChar(Convert.ToUInt32(hs, 16))); } var ascii = sb.ToString(); return ascii; } }
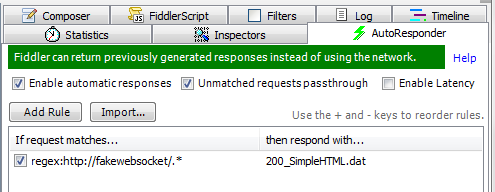
4. Setup Fiddler -> AutoResponder (Optional)
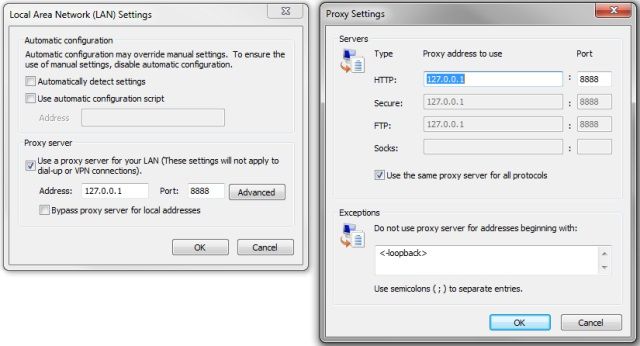
I have tested with Firefox 25.0, IE 11.0, Chrome 32.0. This solution should work with all browsers that support WebSocket, as long as the network proxy is setup correctly. Using IE as an example:
- Open Fiddler, this will setup the network proxy automatically, but it's not enough.
- Open IE -> Tools -> Internet Options -> Connections tab -> Click "LAN settings" button
- Click "Advanced" button
- Tick "Use the same proxy server for all protocols" checkbox.
Points of Interest
- You can test above solution by going to http://www.websocket.org/echo.html, http://socket.io/demos/chat/and https://jabbr.net/ (log-in required. This site is built using SignalR, which supports WebSocket).
- Above code is printing WebSocket frames every 2 seconds to avoid high CPU usage, which means the timestamps in Statistics tab may be delayed for up to 2 seconds. You may adjust this timer depending on your traffic volume.
- However, you can see the actual time when the frame is received, in the Inspector tab -> Request info -> JSON sub-tab -> doneTime.
- For simplicity, I have only created one Queue for all WebSocket sessions, Continuation frames are combined together regardless of their session ID. Feel free to extend my code. For now, just debug one WebSocket session at a time.
- Above code assumes that payload starts with '{' is JSON data, this works very well for me. If this assumptionis wrong in your situation, you can easily modify the code.
- Note: Socket.IO currently prefix a special meaning number before the payload, which makes the frames invalid JSON data, i.e., you cannot see nice formatted frames in JSON sub-tab. You can however still see the frames in Raw sub-tab. Alternatively, you can update my script to handle the number prefix from Socket.IO.
- Please vote my article if you find it useful. Thanks for your support.
转http://www.codeproject.com/Articles/718660/Debug-Inspect-WebSocket-traffic-with-Fiddler
