My App Crashed, Now What? – Part 1
If you're new here, you may want to subscribe to my RSS feed or follow me on Twitter. Thanks for visiting!
This is a post by iOS Tutorial Team member Matthijs Hollemans, an experienced iOS developer and designer.
It happens to the best of us: you’re working happily on your app and all is well, and then suddenly – POOF! – it crashes. Aaargh!! (Cue sad violin.)
The first thing to do is: Don’t panic!
Fixing crashes doesn’t need to be hard. You’re likely to worsen the situation if you freak out and start changing things at random, hoping the bug will magically go away if only you utter the right incantations. Instead, you need to take a methodical approach and learn how to reason your way through a crash.
The first order of business is to find out where exactly in your code the crash occurred: in which file and on which line. The Xcode debugger will help you with this, but you need to understand how to make the best use of it, and that’s exactly what this tutorial will show you!
This tutorial is for all developers, from beginning to advanced. Even if you’re an experienced iOS developer, you’ll probably pick up some tips and tricks along the way you didn’t know about!
Getting Started
Download the example project. As you’ll see, this is one buggy program! When you open the project in Xcode, it shows at least eight compiler warnings, which is always a sign of trouble ahead. By the way, we’re using Xcode 4.3 for this tutorial, although version 4.2 should work just as well.
Note: To follow along with this tutorial, the app needs to be run on the iOS 5 Simulator. If you run the app on your device, you’ll still get crashes, but they may not occur in the same order.
Run the app in the simulator and see what happens.
Hey, it crashes! :-]
There are basically two types of crashes that can happen: SIGABRT (also called EXC_CRASH) andEXC_BAD_ACCESS (which can also show up under the names SIGBUS or SIGSEGV).
As far as crashes go, SIGABRT is a pretty good one to have, because it’s a controlled crash. The app terminated on purpose because the system recognized the app did something it wasn’t supposed to.
EXC_BAD_ACCESS, on the other hand, is a lot harder to debug, because it only happens when the app got into a corrupted state, usually due to a memory management issue.
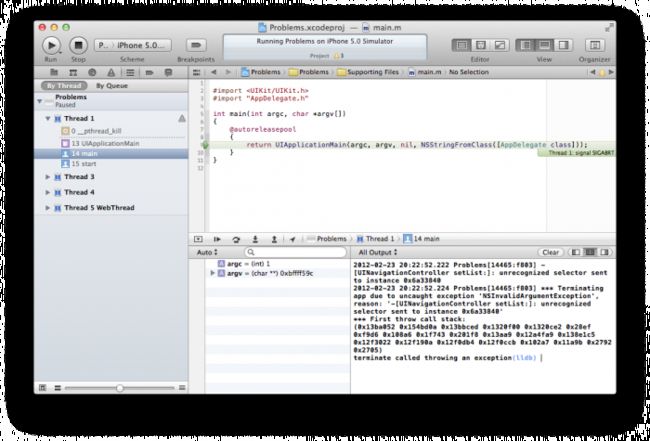
Fortunately, this first crash (of many yet to come) is a SIGABRT. A SIGABRT always comes with an error message that you can see in Xcode’s Debug Output pane (bottom right corner of the window). (If you don’t see the Debug Output pane, tap the middle icon in the View icons section on the top right hand corner of your Xcode window to display the Debug area. If the Debug Output pane still isn’t visible, you might have to tap the middle icon at the top of the Debug area – the icons next to the search field). In this case, it says something like this:
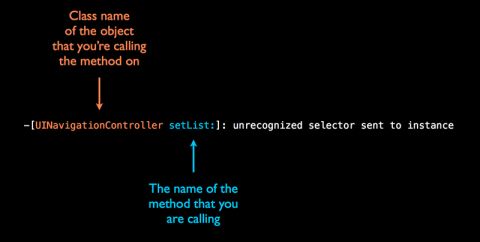
Problems[14465:f803] -[UINavigationController setList:]: unrecognized selector sent to instance 0x6a33840 Problems[14465:f803] *** Terminating app due to uncaught exception 'NSInvalidArgumentException', reason: '-[UINavigationController setList:]: unrecognized selector sent to instance 0x6a33840' *** First throw call stack: (0x13ba052 0x154bd0a 0x13bbced 0x1320f00 0x1320ce2 0x29ef 0xf9d6 0x108a6 0x1f743 0x201f8 0x13aa9 0x12a4fa9 0x138e1c5 0x12f3022 0x12f190a 0x12f0db4 0x12f0ccb 0x102a7 0x11a9b 0x2792 0x2705) terminate called throwing an exception |
It’s important that you learn to decipher these error messages because they contain important clues as to what is going wrong. Here, the interesting part is:
[UINavigationController setList:]: unrecognized selector sent to instance 0x6a33840 |
The error message “unrecognized selector sent to instance XXX” means that the app is trying to call a method that doesn’t exist. Often this happens because the method’s being called on the wrong object. Here, the object in question is UINavigationController (located at memory address 0x6a33840) and the method issetList:.
Knowing the reason for the crash is good, but your first course of action is to figure out where in the code this error occurred. You need to find the name of the source file and the number of the line that’s misbehaving. You can do this using the call stack (also known as the stacktrace or the backtrace).
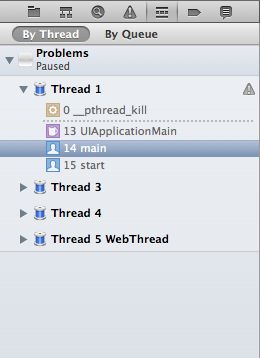
When an app crashes, the left pane of the Xcode window switches to the Debug Navigator. It shows the threads that are active in the app, and highlights the thread that crashed. Usually that will be Thread 1, the main thread of the app, as that is where you’ll be doing most of your work. If your code uses queues or background threads, then the app can crash in the other threads as well.
Currently, Xcode has highlighted the main() function in main.m as the source of the problem. That isn’t telling you very much, so you’ll have to dig a little deeper.
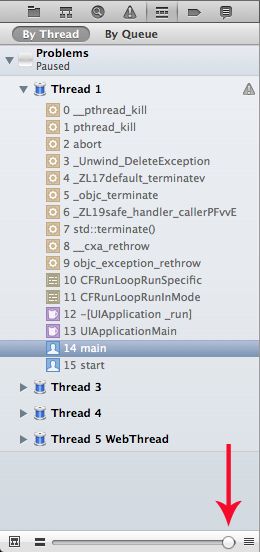
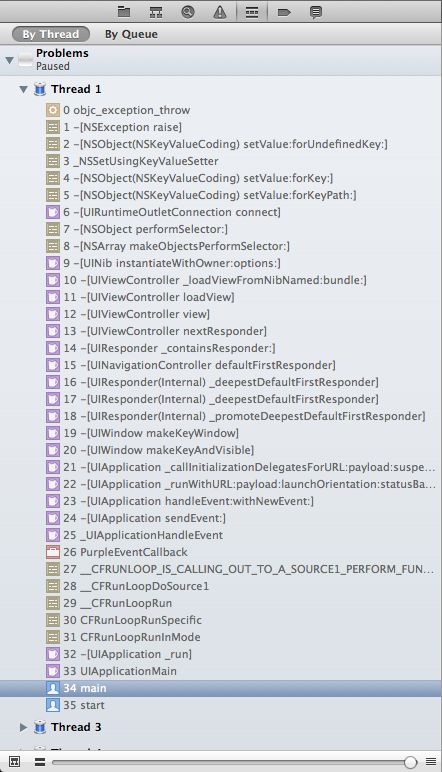
To see more of the call stack, drag the slider at the bottom of the Debug Navigator all the way to the right. That will show the complete call stack at the moment of the crash:
Each of the items from this list is a function or a method from the app or from one of the iOS frameworks. The call stack shows you what functions or methods are currently active in the app. The debugger has paused the app and all of these functions and methods are now frozen in time.
The function at the bottom, start(), was called first. Somewhere in its execution it called the function above it, main(). That’s the starting point of the app, and it will always be near the bottom. main() in turn called UIApplicationMain(). That is the line that the green arrow (at the beginning of the highlighted line on the right pane in Xcode) is pointing to in the editor window.
Going further up the stack, UIApplicationMain() called the _run method on the UIApplication object, which called CFRunLoopRunInMode(), which called CFRunLoopRunSpecific(), and so on, all the way up to__pthread_kill.
All of these functions and methods in the call stack, except for main(), are grayed out. That’s because they come from the built-in iOS frameworks. There is no source code available for them.
The only thing in this stacktrace that you have source code for is main.m, so that’s what the Xcode source editor shows, even though it’s not really the true source of the crash. This often confuses new developers, but in a minute I will show you how to make sense of it.
For fun, click on any one of the other items from the stacktrace and you’ll see a bunch of assembly code which might not make much sense to you:
Oh, if only we had the source code for that! :-]
The Exception Breakpoint
So how do you find the line in the code that made the app crash? Well, whenever you get a stacktrace like this, an exception was thrown by the app. (You can tell because one of the functions in the call stack is named objc_exception_rethrow.)
An exception happens when the program is caught doing something it shouldn’t have done. What you’re looking at now is the aftermath of this exception: the app did something wrong, the exception has been thrown, and Xcode shows you the results. Ideally, you’d want to see exactly where that exception gets thrown.
Fortunately, you can tell Xcode to pause the program at just that moment, using an Exception Breakpoint. Abreakpoint is a debugging tool that pauses your program at a specific moment. You’ll see more of them in the second part of this tutorial, but for now you’ll use a specific breakpoint that will pause the program just before an exception gets thrown.
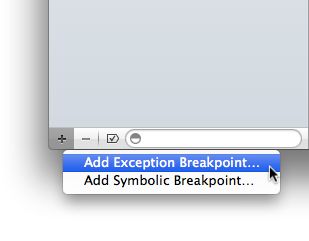
To set the Exception Breakpoint, we have to switch to the Breakpoint Navigator:
At the bottom is a small + button. Click this and select Add Exception Breakpoint:
A new breakpoint will be added to the list:
Click the Done button to dismiss the pop-up. Notice that the Breakpoints button in Xcode’s toolbar is now enabled. If you want to run the app without any breakpoints enabled, you can simply toggle this button to off. But for now, leave it on and run the app again.
That’s better! The source code editor now points to a line from the source code – no more nasty assembly stuff – and notice that the call stack on the left (you might need to switch to the call stack via the Debug Navigator depending on how you have Xcode set up) also looks different.
Apparently, the culprit is this line in the AppDelegate’s application:didFinishLaunchingWithOptions:method:
viewController.list = [NSArray arrayWithObjects:@"One", @"Two"]; |
Take a look at that error message again:
[UINavigationController setList:]: unrecognized selector sent to instance 0x6d4ed20 |
In the code, “viewController.list = something” calls setList: behind the scenes, because “list” is a property on the MainViewController class. However, according to the error message the viewController variable does not point to a MainViewController object but to a UINavigationController – and of course, UINavigationController does not have a “list” property! So things are getting mixed up here.
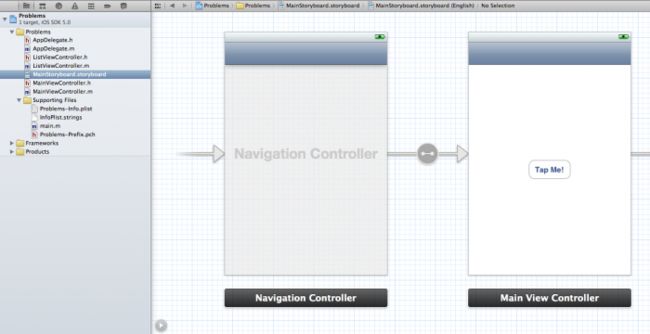
Open the Storyboard file to see what the window’s rootViewController property actually points to:
Ah ha! The storyboard’s initial view controller is a Navigation Controller. That explains why window.rootViewController is a UINavigationController object instead of the MainViewController that you’d expect. To fix this, replace application:didFinishLaunchingWithOptions: with the following:
- (BOOL)application:(UIApplication *)application didFinishLaunchingWithOptions:(NSDictionary *)launchOptions { UINavigationController *navController = (UINavigationController *)self.window.rootViewController; MainViewController *viewController = (MainViewController *)navController.topViewController; viewController.list = [NSArray arrayWithObjects:@"One", @"Two"]; return YES; } |
First you get a reference to the UINavigationController from self.window.rootViewController, and once you have that you can get the pointer to the MainViewController by asking the navigation controller for its topViewController. Now the viewController variable should point to the proper object.
Note: Whenever you get a “unrecognized selector sent to instance XXX” error, check that the object is of the right type and that it actually has a method with that name. Often you’ll find that you’re calling a method on a different object than you thought, because a pointer variable may not contain the right value.
Another common reason for this error is a misspelling of the method name. You’ll see an example of this in a bit.
Your First Memory Error
That should have fixed our first problem. Run the app again. Whoops, it crashes at the same line, only now with an EXC_BAD_ACCESS error. That means the app has a memory management problem.
The source of a memory-related crash is often hard to pinpoint, because the evil may have been done much earlier in the program. If a malfunctioning piece of code corrupts a memory structure, the results of this may not show up until much later, and in a totally different place.
In fact, the bug may never show up for you at all while testing, and only rear its ugly head on the devices of your customers. You don’t want that to happen!
This particular crash, however, is easy to fix. If you look at the source code editor, Xcode has been warning you about this line all along. See the yellow triangle on the left next to the line numbers? That indicates a compiler warning. If you click on the yellow triangle, Xcode should pop up a “Fix-it” suggestion like this:
The code initializes an NSArray object by giving it a list of objects, and such lists are supposed to be terminated using nil, the sentinel referred to in the warning. But that wasn’t done and now NSArray gets confused. It tries to read objects that don’t exist, and the app crashes hard.
This is a mistake you really shouldn’t make, especially since Xcode already warns you about it. Fix the code by adding nil to the list as follows (Or, you can simply select the “Fix-it” option from the menu):
viewController.list = [NSArray arrayWithObjects:@"One", @"Two", nil]; |
“This class is not key value coding-compliant”
Run the app again to see what other fun bugs this project has in store for you. And what do you know? It crashes again on main.m. Since the Exception Breakpoint is still enabled and we do not see any app source code highlighted, this time the crash truly didn’t happen in any of the app source code. The call stack corroborates this: none of these methods belong to the app, except main():
If you look through the method names from the top going down, there is some stuff going on with NSObject and Key-Value Coding. Below that is a call to [UIRuntimeOutletConnection connect]. I have no idea what that is, but it looks like it has something to do with connecting outlets. Below that are methods that talk about loading views from a nib. So that gives you some clues already.
However, there is no convenient error message in Xcode’s Debug Pane. That’s because the exception hasn’t been thrown yet. The Exception Breakpoint has paused the program just before it tells you the reason for the exception. Sometimes you get a partial error message with the Exception Breakpoint enabled, and sometimes you don’t.
To see the full error message, click the “Continue Program Execution” button in the debugger toolbar:
You may need to click it more than once, but then you’ll get the error message:
Problems[14961:f803] *** Terminating app due to uncaught exception 'NSUnknownKeyException', reason: '[<MainViewController 0x6b3f590> setValue:forUndefinedKey:]: this class is not key value coding-compliant for the key button.' *** First throw call stack: (0x13ba052 0x154bd0a 0x13b9f11 0x9b1032 0x922f7b 0x922eeb 0x93dd60 0x23091a 0x13bbe1a 0x1325821 0x22f46e 0xd6e2c 0xd73a9 0xd75cb 0xd6c1c 0xfd56d 0xe7d47 0xfe441 0xfe45d 0xfe4f9 0x3ed65 0x3edac 0xfbe6 0x108a6 0x1f743 0x201f8 0x13aa9 0x12a4fa9 0x138e1c5 0x12f3022 0x12f190a 0x12f0db4 0x12f0ccb 0x102a7 0x11a9b 0x2872 0x27e5) terminate called throwing an exception |
As before, you can ignore the numbers at the bottom. They represent the call stack, but you already have that in a more convenient – and readable! – format in the Debug Navigator on the left.
The interesting bits are:
- NSUnknownKeyException
- MainViewController
- “this class is not key value coding-compliant for the key button”
The name of the exception, NSUnknownKeyException, is often a good indicator of what is wrong. It tells you there is an “unknown key” somewhere. That somewhere is apparently MainViewController, and the key is named “button.”
As we’ve already established, all of this happens while loading the nib. The app uses a storyboard rather than nibs, but internally the storyboard is just a collection of nibs, so it must be a mistake in the storyboard.
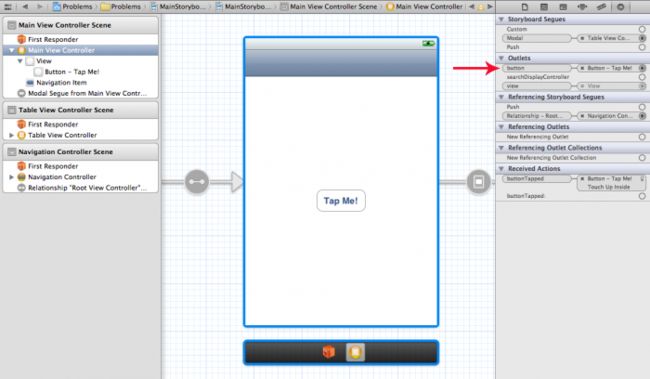
Check out the outlets on MainViewController:
In the Connections Inspector, you can see that the UIButton in the center of the view controller is connected to MainViewController’s “button” outlet. So the storyboard/nib refers to an outlet named “button,” but according to the error message it can’t find this outlet.
Have a look at MainViewController.h:
@interface MainViewController : UIViewController @property (nonatomic, retain) NSArray *list; @property (nonatomic, retain) IBOutlet UIButton *button; - (IBAction)buttonTapped:(id)sender; @end |
The @property definition for the “button” outlet is there, so what’s the problem? If you’ve been paying attention to the compiler warnings, you may have figured it out already.
If not, check out MainViewController.m/s @synthesize list. Do you see the problem now?
The code doesn’t actually @synthesize the button property. It tells MainViewController that it has a property named “button,” without providing it with a backing instance variable and getter and setter methods (which is what @synthesize does).
Add the following to MainViewController.m below the existing @synthesize line to fix this issue:
@synthesize button = _button; |
Now the app should no longer crash when you run it!
Note: The error “this class is not key value coding-compliant for the key XXX” usually occurs when loading a nib that refers to a property that doesn’t actually exist. This usually happens when you remove an outlet property from your code but not from the connections in the nib.
Push the Button
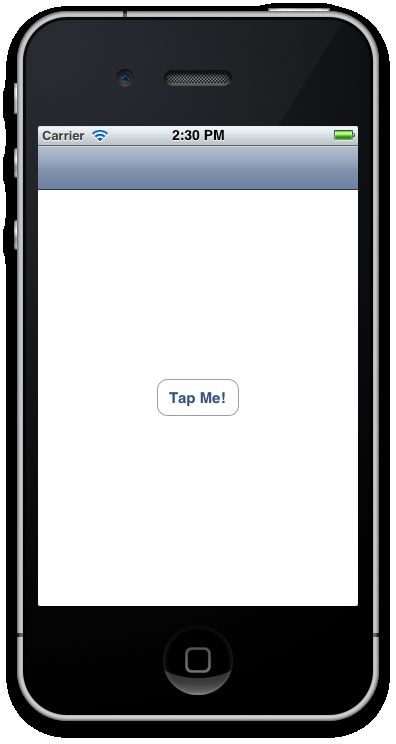
Now that the app works – or at least starts up without problems –, it’s time to tap that button.
Woah! The app crashes with a SIGABRT on main.m. The error message in the Debug Pane is:
Problems[6579:f803] -[MainViewController buttonTapped]: unrecognized selector sent to instance 0x6e44850 |
The stack trace isn’t too illuminating. It lists a whole bunch of methods that are related one way or the other to sending events and performing actions, but you already know that actions were involved. After all, you tapped a UIButton and that results in an IBAction method being called.
Of course, you’ve seen this error message before. A method is being called that does not exist. This time the target object, MainViewController, looks to be the right one since action methods usually live in the view controller that contains the buttons. And if you look in MainViewController.h, the IBAction method is there indeed:
- (IBAction)buttonTapped:(id)sender; |
Or is it? The error message says the method name is buttonTapped, but MainViewController has a method named buttonTapped:, with a colon at the end because this method accepts one parameter (named “sender”). The method name from the error message, on the other hand, does not include a colon and therefore takes no parameters. The signature for that method looks like this instead:
- (IBAction)buttonTapped; |
What happened here? The method initially did not have a parameter (something that is allowed for action methods), at which time the connection in the storyboard was made to the button’s Touch Up Inside event. However, some time after that, the method signature was changed to include the “sender” parameter, but the storyboard was not updated.
You can see this in the storyboard, on the Connections Inspector for the button:
First disconnect the Touch Up Inside event (click the small X), then connect it to the Main View Controller again, but this time select the buttonTapped: method. Notice that in the Connections Inspector there is now a colon after the method name.
Run the app and tap the button again. What the?! Again you get the “unrecognized selector” message, although this time it correctly identifies the method as buttonTapped:, with the colon.
Problems[6675:f803] -[MainViewController buttonTapped:]: unrecognized selector sent to instance 0x6b6c7f0 |
If you look closely, the compiler warnings should point you to the solution again. Xcode complains that the implementation of MainViewController is incomplete. Specifically, the method definition for buttonTapped:is not found.
Time to look at MainViewController.m. There certainly appears to be a buttonTapped: method in there, although… wait a minute, it’s spelled wrong:
- (void)butonTapped:(id)sender |
Easy enough to fix. Rename the method to:
- (void)buttonTapped:(id)sender |
Note that you don’t necessarily need to declare it as IBAction, although you can do so if you think that is neater.
Note: This sort of thing is easy to catch if you’re paying attention to the compiler warnings. Personally, I treat all warnings as fatal errors (there is even an option for this in the Build Settings screen in Xcode) and I’ll fix each and every one of them before running the app. Xcode is pretty good at pointing out silly mistakes such as these, and it’s wise to pay attention to these hints.
Messing with Memory
You know the drill: run the app, tap the button, wait for the crash. Yep, there it is:
It’s another one of those EXC_BAD_ACCESS ones, yikes! Fortunately, Xcode shows you exactly where the crash happened, in the buttonTapped: method:
NSLog("You tapped on: %s", sender); |
Sometimes these mistakes may take a moment or two to register in your mind, but again Xcode lends a helping hand – just tap the yellow triangle to see what’s wrong:
NSLog() takes an Objective-C-type string, not a plain old C-string, so inserting an @ will fix it:
NSLog(@"You tapped on: %s", sender); |
You’ll notice that the warning yellow triangle doesn’t go away. This is because this line has another bug that may or may not crash your app. Those are the fun ones. Sometimes the code works just fine – or at leastappears to work just fine – and at other times it will crash. (Of course, these sorts of crashes only happen on customers’ devices, never on your own.)
Let’s see what the new warning is:
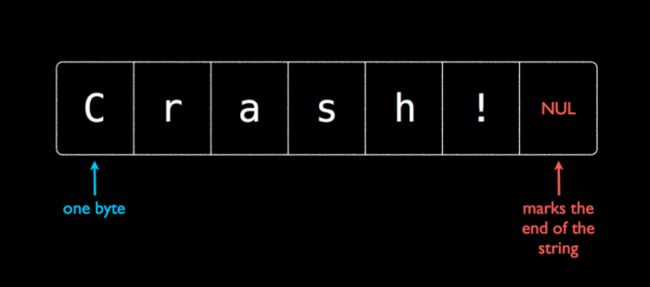
The %s specifier is for C-style strings. A C-string is just a section of memory – a plain old array of bytes – that is terminated by a so-called “NUL character,” which is really just the value 0. For example, the C-string “Crash!” looks like this in memory:
Whenever you use a function or method that expects a C-style string, you have to make sure the string ends with the value 0, or the function will not recognize that the string has ended.
Now, when you specify %s in an NSLog() format string – or in NSString’s stringWithFormat – then the parameter is interpreted as if it were a C-string. In this case, “sender” is the parameter, and it’s a pointer to a UIButton object, which is definitely not a C-string. If whatever “sender” points to contains a 0 byte, then the NSLog() will not crash, but output something such as:
You tapped on: xËj |
You can actually see where this comes from. Run the app again, tap the button and wait for the crash. Now, in the left half of the Debug Pane, right-click on “sender” and pick the “View Memory of *sender” option (make sure to choose the one with the asterisk in front of sender).
Xcode will now show you the memory contents at that address, and it’s exactly what NSLog() printed out.
However, there is no guarantee there is a NUL byte, and you could just as easily run into a EXC_BAD_ACCESS error. If you’re always testing your app on the simulator that may not happen for a long time, as the circumstances may always be in your favor in your particular testing environment. That makes these kinds of bugs very hard to trace.
Of course, in this case Xcode has already warned you about the wrong format specifier, so this particular bug was easy to find. But whenever you’re using C-strings or manipulating memory directly, you have to be very careful not to mess around with someone else’s memory.
If you’re lucky the app will always crash and the bug is easy to find, but more commonly, the app will only crash sometimes – making the problem hard to reproduce! – and then the hunt for the bug can take on epic proportions.
Fix the NSLog() statement as follows:
NSLog(@"You tapped on: %@", sender); |
Run the app and press the button once more. The NSLog() does what it’s supposed to, but looks as if you’re not done crashing in buttonTapped: yet.
Making Friends With the Debugger
For this latest crash, Xcode points at the line:
[self performSegueWithIdentifier:@"ModalSegue" sender:sender]; |
There is no message in the Debug Pane. You can press the Continue Program Execution button like you did before, but you can also type a command in the debugger to get the error message. The advantage of doing this is that the app can stay paused in the same place.
If you’re running this from the simulator, you can type the following after the (lldb) prompt:
(lldb) po $eax |
LLDB is the default debugger for Xcode 4.3 and up. If you’re using an older version of Xcode, then you have the GDB debugger. They share some basic commands, so if your Xcode prompt says (gdb) instead of (lldb), you should still be able to follow along without a problem. (By the way, you can switch between debuggers in the Scheme editor in Xcode, under the Run action. And you can access the Scheme editor by Alt-tapping the Run icon at the top left corner of your Xcode window.)
The po command stands for “print object.” The symbol $eax refers to one of the CPU registers. In the case of an exception, this register will contain a pointer to the NSException object. Note: $eax only works for the simulator, if you’re debugging on the device you’ll need to use register $r0.
For example, if you type:
(lldb) po [$eax class] |
You will see something like this:
(id) $2 = 0x01446e84 NSException |
The numbers aren’t important, but it’s obvious you’re dealing with an NSException object here.
You can call any method from NSException on this object. For example:
(lldb) po [$eax name] |
This will give you the name of the exception, in this case NSInvalidArgumentException, and:
(lldb) po [$eax reason] |
This will give you the error message:
(unsigned int) $4 = 114784400 Receiver (<MainViewController: 0x6b60620>) has no segue with identifier 'ModalSegue' |
Note: When you just do “po $eax”, it will call the “description” method on the object and print that, which in this case also gives you the error message.
So that explains what’s going on: you’re attempting to perform a segue named “ModalSegue” but apparently there is no such segue on the MainViewController.
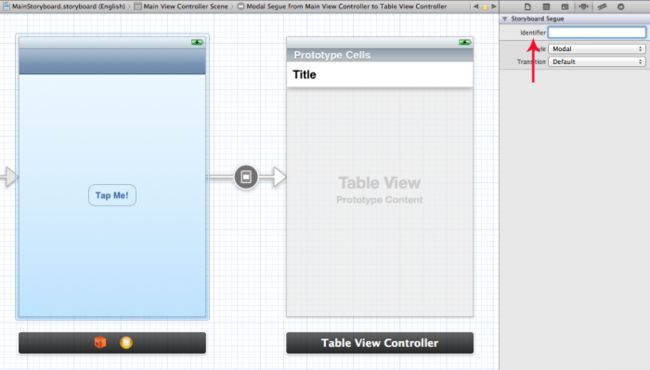
The storyboard does show that a segue is present, but you’ve forgotten to set its identifier, a typical mistake:
Change the segue identifier to “ModalSegue.” Run the app again, and – wait for it – tap the button. Whew, no more crashes this time! But here’s a teaser for our next part – the table view that shows up isn’t supposed to be empty!
Where to Go From Here?
So what about that empty table? I’m going to hold you in suspense for now. You’ll tackle it in Part Two of this tutorial, along with some more fun bugs you’re likely to come across in your coding life. And in Part Two, you’ll add some more tools to your debugging arsenal, including the NSLog() statement, breakpoints and Zombie Objects.
When all is said and done, I promise that the app will run as its supposed to! More importantly, you’ll have accrued skills for when you run into these frustrations in your own apps – as you inevitably will.

