scikit-learn:3.5. Validation curves: plotting scores to evaluate models
参考:http://scikit-learn.org/stable/modules/learning_curve.html
estimator's generalization error can be decomposed in terms ofbias, variance and noise. The bias of an estimator is its average error for different training sets. The variance of an estimator indicates how sensitive it is to varying training sets. Noise is a property of the data.
首先介绍背景,进而引入本节要讲的内容,背景就是:
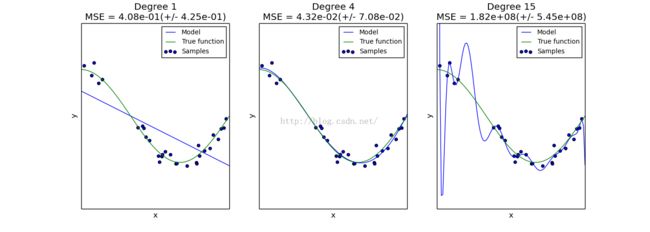
针对函数COS(1.5π x),分别使用不同的estimators fit the function:linear regression with polynomial features of degree 1, 4 and 15,结果图如下:
图一high bias,图二刚好,图三high variance。但,,,,这并不是重点。。。。。。。。。。。
重点是:对于一维的COS函数,可以通过画图来辨别bias或variance。但对于高维的例子,不能通过画图来识别,此时,下面要讲的内容就helpful了。。。。
1、Validation curve
为了验证一个模型,我们需要一个scoring function(see Model evaluation: quantifying the quality of predictions,翻译文章:http://blog.csdn.net/mmc2015/article/details/47121611)。而为了找到较好的超参数的组合,我们常使用grid search或类似方法 (seeGrid Search: Searching for estimator parameters,翻译文章:http://blog.csdn.net/mmc2015/article/details/47100091) ,在grid search过程中,我们希望找到使validation sets最大的score对应的超参数组合。(注意,validation sets一旦使用,对于模型就是有bias的,所以对于generalization,一定要再选择其他独立的test sets验证。)
然而并不是重点。。。。。
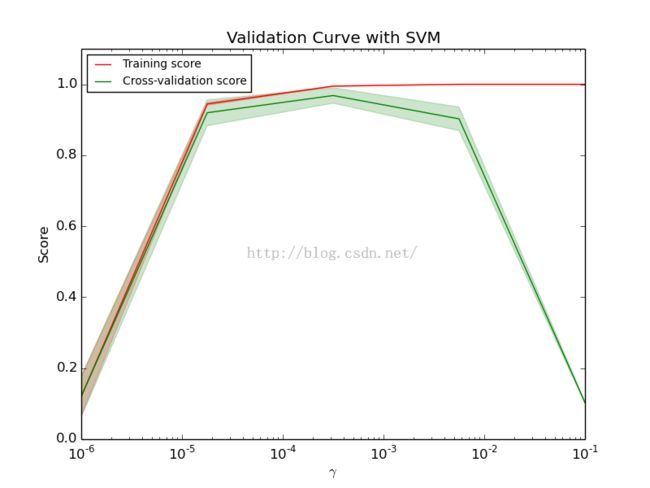
重点是,我们希望可以plot the influence of a single hyperparameter on the training score and the validation score,这样有助于分析estimator是否overfitting、underfitting。。
training score and the validation score都low,说明estimator underfittig;training score high but the validation score low,说明overfitting;training score and the validation score都high,说明效果比较好(上图告诉我们,参数gamma最好选择0.001-0.0001);training score low but the validation score high,可能性不大。
(其实该方法不是很实用,因为模型不仅受一个参数的影响,还会受其他参数的综合影响,还是grid search靠谱;如果只有一个参数,那么该方法比较好。)
2、Learning curve
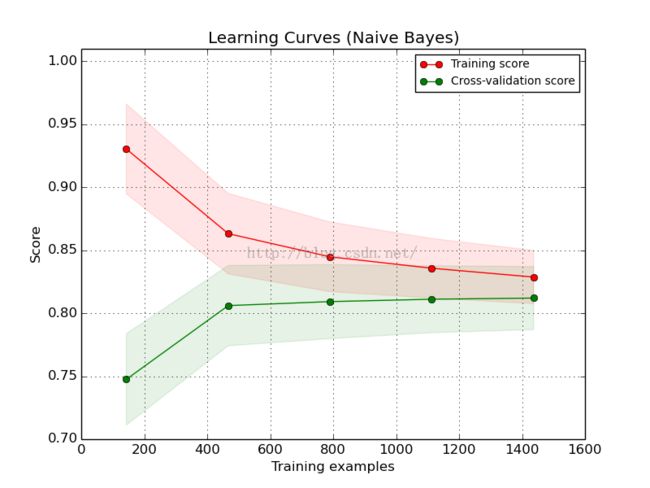
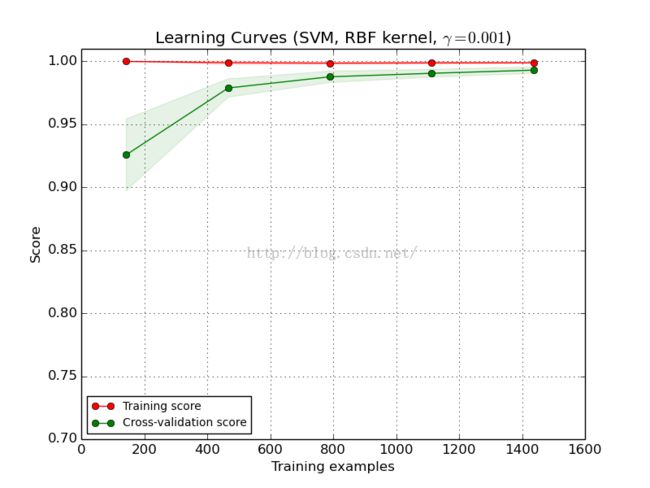
A learning curve shows the validation and training score of an estimator for varying numbers of training samples.
如上图,If both the validation score and the training score converge to a value that is too low with increasing size of the training set, we will not benefit much from more training data.这时,需要考虑换estimator或者调参数。
如上图,If the training score is much greater than the validation score for the maximum number of training samples, adding more training samples will most likely increase generalization.这时,需要考虑获取更多的samples。
上面几幅图的产生程序参考:
- Underfitting vs. Overfitting
- Plotting Validation Curves
- Plotting Learning Curves


