漂亮,美观的图表之Matlab强势回归~~~~走你6
%% 本文讲述数据分析
 %% 先加载数据
 load distriAnalysisData;
 % 设置figure大小,位置。
 figure('units','normalized','position',[  0.2099    0.6269    0.4354    0.2778]);
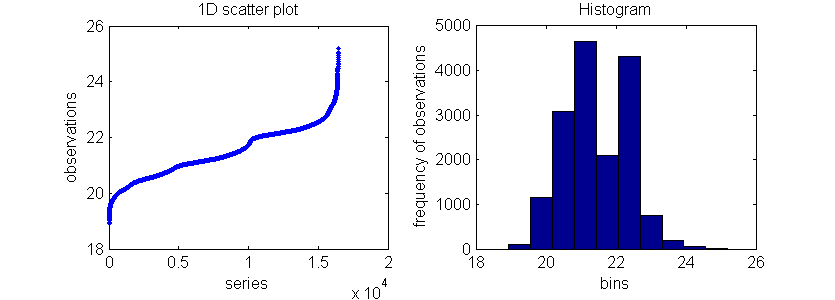
subplot(1,2,1);
plot(sort(B),'.');
xlabel('series');
ylabel('observations');
title('1D scatter plot');
subplot(1,2,2);
hist(B);
xlabel('bins');
ylabel('frequency of observations');
title('Histogram');
% 设置figure,背景颜色
set(gcf,'Color',[1 1 1],'paperpositionmode','auto');
ex2:
B是一个20000*1的数组

figure('units','normalized','position',[  0.2099    0.6269    0.4354    0.2778]);
[N c] = hist(B,round(sqrt(length(B))));
bar(c,N);  % N表示每个直方条的宽度
title('Alternate binning, bin size = sqrt(n)');
xlabel('bins');
ylabel('frequency of observations');
title('Histogram, with an optimal bin size to reveal underlying structure of data');
set(gcf,'Color',[1 1 1],'paperpositionmode','auto');
ex3:
%% 最后我们将以一个混合的正太分布去满足直方图配置。我们将去评估我们的模型
sigma_amp1 mu分别是均值,标准差

sigma_ampl = [79.267229       8.121365              5       6.254915       5.062882      11.117357      577.45966      531.38438      962.45674           1800           1800      357.92132];
mu=[29 38 51 70 103 133];
% Gaussian mixture model
f_sum=0;x=1:200;
for i=1:6
    f_sum=f_sum+sigma_ampl(i+6)./(sigma_ampl(i)).*exp(-(x-mu(i)).^2./(2*sigma_ampl(i).^2));
end
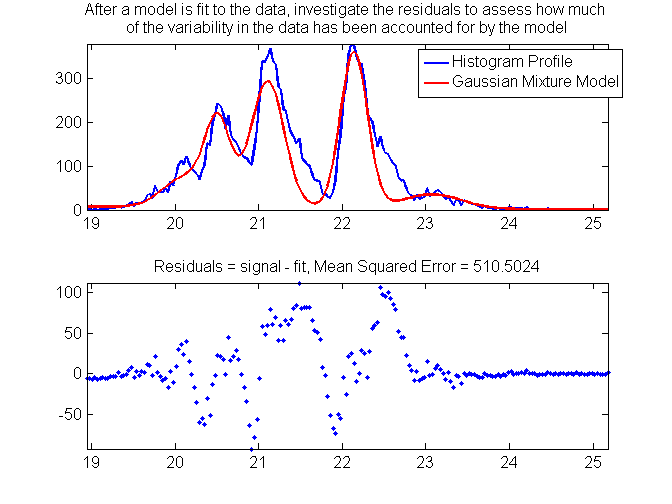
subplot(2,1,1);
clear h;
h(1)=plot(c,env,'Linewidth',1.5);hold on;
h(2)=plot(c,f_sum,'r','Linewidth',1.5); axis tight
legendflex(h,{'Histogram Profile','Gaussian Mixture Model'},'ref',gcf,'anchor',{'ne','ne'},'xscale',.5,'buffer',[-50 -50]);
title({'After a model is fit to the data, investigate the residuals to assess how much ','of the variability in the data has been accounted for by the model'});
subplot(2,1,2);
plot(c,env-f_sum,'.');
 axis tight;
title(['Residuals = signal - fit, Mean Squared Error = ' num2str(sqrt(sum(abs(env-f_sum).^2)))]);
set(gcf,'Color',[1 1 1],'paperpositionmode','auto');
重点看legendflex,interp1

