After research js chart library, I determine to use RGraph:http://www.rgraph.net/
RGraph:是基于HTML5的canvas标签,采用Javascript画图的库。
优点:由于是采用js在客户端浏览器上画图,所以它能快速显示页面和减轻服务器负载。
缺点:浏览器必须支持HTML5,不能够保存图表。(I think it can be saved as picture easierly)
本文介绍一款名叫Rgraph的插件,使用RGraph统计图制作插件的话,可以将这个资源占用减少到接近零的程度,因为所有创建统计图的工作都是在客户端完成的,就像渲染HTML网页一样,服务器端只负责发送数据,不再负责统计图的生成与发送了,同时带宽的占用情况也大大得到了改善。
另外,由于统计图是依靠JavaScript来生成的,所以当你查看这个显示统计图的HTML网页的时候,该网页是可以为离线状态的了。
chart.gutter.right就是当前chart相对于你的canvas的左边距;
chart.hmargin.grouped就是每一组bar里面的每个柱形的间距。
Some document about RGraph:
1. 使用HTML5 RGraph插件绘制统计图 - Bar chart
http://www.html5star.com/article-107-1.html (教程)
http://download.csdn.net/download/mythgaga/4049660 (实例下载)
2.HTML5:使用RGraph绘制折线图
http://www.cnblogs.com/shanyou/archive/2012/10/22/2734570.html
3. 加载JSON文件并在 RGraph 中以 柱状图来展示
http://blog.csdn.net/lowkeyway/article/details/7967649
http://www.runqian.com.cn/archives/4010.html/
4. How to use JSON data
http://www.rgraph.net/docs/howto-json-data.html
Note :
1. Many browsers restrict JavaScript from accessing localfile system owing to security reasons. The JavaScript charts, when runninglocally, will not be able to access data provided as a URL. If you run thefiles from a server, it will run absolutely fine, though. When running locally,however, if you provide the data as string (using theData Stringmethod), it works fine.
2. For support for Internet Explorer < 9, you can useExcanvas, a canvas emulator; this is used in the examples bundledwith Flot. You just include the excanvas script like this:
<!--[if lte IE8]><script language="javascript"type="text/javascript"src="excanvas.min.js"></script><![endif]-->
关于RGraph
<script type="text/javascript" src="../libraries/RGraph.common.core.js" ></script>
<script type="text/javascript" src="../libraries/RGraph.bar.js" ></script>
官方API: http://www.rgraph.net/docs/bar.html
RGraph.Bar
1、
<canvas id="cvs" width="600" height="250"> </canvas>
var bar =new RGraph.Bar("cvs",[5,4,1,6,8,5,3]);//
RGraph.Bar = function (id, data)
bar.Set('chart.labels',
//x轴的名称。
['Monday','Tuesday','Wednesday','Thursday','Friday','Saturday','Sunday']);
bar.Draw();
y轴上的默认为最高的。不过可以设置bar5.Set('chart.ymax', 150);
2、
var bar5 = new RGraph.Bar('cvs',
[[45,60,112],[65,30,50],[40,80,70],[115,100,92]]);//一组一组的
bar5.Set('chart.colors', ['#CC1111', '#11CCCC', '#1111CC']);//颜色可以不同哈。
bar5.Set('
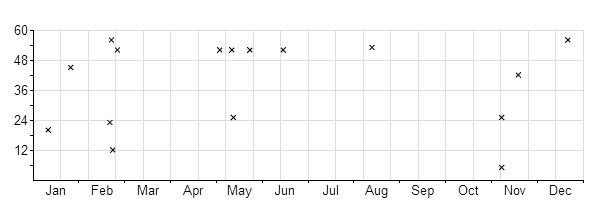
chart.tooltips', ['January','February','March', 'January','February','March',
'January','February','March', 'January','February','March']);//点击过后提示的。
bar5.Set('
chart.strokestyle', "blue");//描边。
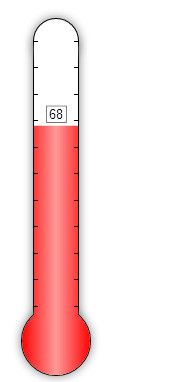
bar5.Set('
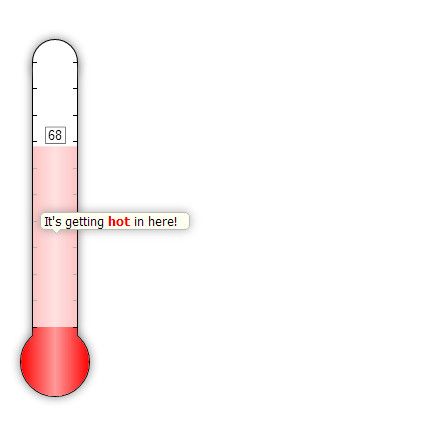
chart.ymax', 150);
bar5.Draw();
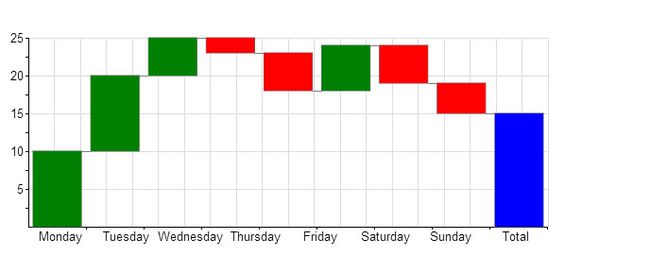
bar5.Set('chart.labels', ['Bob', 'Jamie', 'Cynthia', 'Peter']);
3、
bar.Set('chart.key.background', 'rgb(255,255,255)');//The color of the key background. Typically white, you could set this to something like rgba(255,255,255,0.7) to allow people to see things behind it.Default: white
bar.Set('chart.key.position', 'graph');//Determines the position of the key.Either graph (default), or gutter.Default: graph
bar.Set('chart.background.image', '../images/bg.png');
bar.Set('chart.key', ['Sunshine in 2000', 'Sunshine in 2005']);//上面的小正方形。
bar.Set('chart.background.grid', true);//是否有背景的格子。默认有。
bar.Set('chart.key.position.gutter.boxed', true);//If you have the key in gutter mode (ie horizontal), this controls whether it has a border.Default: true
bar.Set('chart.gutter.left', 100);//
The left gutter of the chart, (the gutter is where the labels and title are)).Default: 25
bar.Set('chart.hmargin.grouped', 10);
RGraph.Effects.Fade.In(bar, {'duration': 500, 'frames':1});
bar.Set('chart.shadow', true);
bar.Set('chart.shadow.blur', 15);
bar.Set('chart.shadow.offsetx', 0);
bar.Set('chart.shadow.offsety', 0);
bar.Set('chart.shadow.color', '#aaa');
bar4.Set('chart.numyticks', 2);//把y轴分为几段。y轴上的
bar4.Set('chart.scale.round', true);//Whether to round the maximum scale value up or not. This will produce slightly better scales in some instances...Default: null y轴总高度是否变化为y值最大的那个。
bar4.Set('chart.variant', '3d');//实现3d。
bar4.Set('chart.ylabels.count', 5);//y上的标签个数。
5、
bar7.Set('chart.variant', 'sketch');//上图的曲线
bar7.Set('chart.variant.sketch.verticals', false);//垂直的曲线。
bar7.Set('chart.text.font', 'Comic sans MS');
bar7.Set('chart.text.size', 18);
bar7.Set('chart.labels.above', true);//使其在上面。
bar7.Set('chart.labels.above.specific', ['Apples', 'Oranges', 'Kiwi', 'Grapes', 'Mango', 'Kum-quat']);//上面的标签。
bar7.Set('chart.labels.above.size', 18);//上面的标签的大小
bar7.Set('chart.ylabels.specific', [
'Lots',
'','','','','','','','','','','','','','','','','','','','',
'','','','','','','','','','','','','','','','','','','','',
'Not so much']);//y轴的描述。
6、
bar6.Set('chart.annotatable', true);//annotated注释。。是否可以注释,在上面画。
7、
bar7.Set('chart.background.grid.vlines', false);//背景的垂直方格线
bar7.Set('chart.background.grid.border', true);//背景方格的边框
8、
上图点击过后会出现另一个图哦,
bar8.Set('chart.tooltips',
function (index) {
var label = bar8.Get('chart.labels')[index];
return '<h2 style="text-align: center">' + label + '</h2><canvas id="tooltip_canvas" width="250" height="110"></canvas>';});
bar8.ontooltip = function (obj)
{
var pie_data = [
[80,75,65],
[84,85,95],
[43,54,85],
[43,51,62],
[74,75,65],
[78,85,95],
[46,35,52],
[84,94,94]
]
var tooltip = RGraph.Registry.Get('chart.tooltip');
var index = tooltip.__index__;
var pie = new RGraph.Pie('tooltip_canvas', pie_data[index]);
pie.Set('chart.labels', ['Monday','Tuesday','Wednesday']);
pie.Set('chart.gutter.top', 10);
pie.Set('chart.gutter.bottom', 25);
pie.Draw();
}
9、
var idx = 2;
var x = bar9.coords[idx][0] + (bar9.coords[idx][2] / 2);
var y = bar9.coords[idx][1];
var r = 5;
marker = new RGraph.Drawing.Marker1('cvs', x, y, r, 'A');
marker.Set('chart.tooltips', ['John was the winner by a country mile.']);
10、bar9.Set('chart.hmargin', 15);
11、
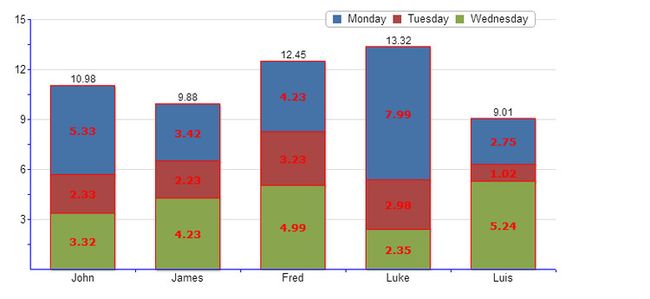
bar.Set('chart.key', ['Monday','Tuesday','Wednesday']);//上面的monday tuesday wednesday
bar.Set('chart.key.color.shape', 'circle');
bar.Set('chart.axis.color', 'blue');//axis 轴。轴的颜色
bar.Set('chart.noyaxis', false);//有无y轴。
bar.Set('chart.grouping', 'stacked');//像栈一样堆放。
bar.Set('chart.labels.above.decimals', 2);//小数点后面的位置。
bar.Set('chart.linewidth', 2);//边框宽度。
bar.Set('chart.strokestyle', 'red');//边框颜色。
12、
bar.Set('chart.units.pre', '?');
bar.Set('chart.title', 'An example Bar chart');
bar.Set('chart.colors', [
RGraph.LinearGradient(bar, 0,225,0,0, 'white', 'rgba(255, 176, 176, 0.5)'),
RGraph.LinearGradient(bar, 0,225,0,0, 'white', 'rgba(153, 208, 249,0.5)')
]);
bar.Set('chart.background.grid.autofit.numhlines', 5);
bar.Set('chart.background.grid.autofit.numvlines', 4);
RGraph.Effects.Fade.In(bar, {'duration': 1000}); //进入动画。
13、
上面的线是动画。
bar.Set('chart.ylabels', false);//线的y轴是否出现。
line.Set('chart.spline', true);//spline曲线尺
line.Set('chart.tickmarks', 'endsquare');上图的开始和结束的地方。
RGraph.Effects.Line.jQuery.Trace(line);
14、
var bar = new RGraph.Bar('cvs', [4,8,5,3,4,6,8]);
bar.Set('chart.labels', ['Mon','Tue','Wed','Thu','Fri','Sat','Sun']);
bar.Draw();
bar.onclick = function (e, shape)
{
ModalDialog.Show('string:<h1>A sample dialog</h1><center><a href="javascript:ModalDialog.Close()">Close</a></center>');
}
bar.onmousemove = function (e, shape)
{
e.target.style.cursor = 'pointer';
}
ModalDialog.onmodaldialog = function (obj)
{
alert('In the onmodaldialog DOM1 style event listener');
}
RGraph.Bipolar
15、
var bipolar = new RGraph.Bipolar('cvs', [4,6,3,5,8],[4,6,5,9,2]);
bipolar.Set('chart.labels', ['John','Luke','Pete','Jane','Fred']);
bipolar.Draw();
RoundRobin
16、
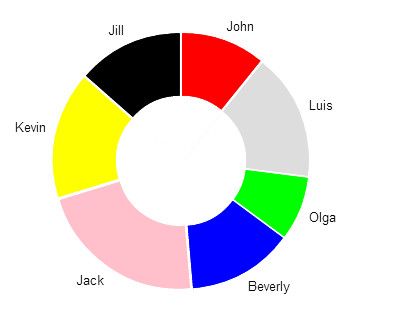
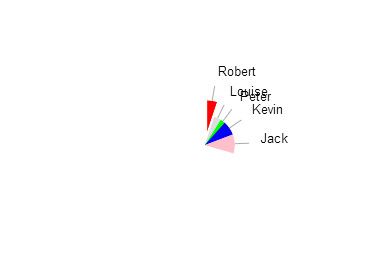
donut.Set('chart.variant', 'donut');
donut.Set('chart.exploded', 30);//圆环之间的距离。
17、
上图是一个动画,很快的速度合成一个圆。
RGraph.Effects.Pie.RoundRobin(donut, {'radius': false});//是否从圆心开始动画。
18、
var fuel = new RGraph.Fuel('cvs', 0, 100, 56);//fuel燃料表。
RGraph.Funnel
19、
var funnel = new RGraph.Funnel('cvs', [100,42,34,23]);//漏斗
funnel.Set('chart.labels.sticks', false);//labels和图之间的sticks。
funnel.Set('chart.text.boxed', true);//labels用不用方框括起来。
20、
var gantt1 = new RGraph.Gantt('cvs');//甘特(图表)设计的
gantt1.Set('chart.events', [
[31, 28, 67, 'Richard'], [0, 28, 50, 'Rachel'], [12, 28, 45, 'Fred'],
[59, 14, 0, 'Barney'], [59, 21, 5, 'Gloria'], [46, 31, 92, 'Paul'],
[80, 21, 46, 'Harry'], [94, 17, 84, 'Shane'], [34, 14, 32, 'Kyle'],
[64, 14, 28, 'Cynthia'], [13, 61, 74, 'Mabel'], [84, 31, 16, 'Paul'],
[80, 22, 45, 'Kiffen'], [0, 115, 50, 'John']
]);
RGraph.Gauge
21、
var gauge = new RGraph.Gauge('cvs', 0, 10, 30);//计量器;标准尺寸
//RGraph.Gauge = function (id, min, max, value)
22、
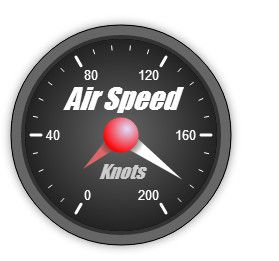
var gauge = new RGraph.Gauge('cvs', 0, 200, [184,12]);//两个值。
gauge.Set('chart.centerpin.color', 'red');//中间的中心梢 颜色。
gauge.Set('chart.title.top', 'Air Speed');
gauge.Set('chart.title.top.size', 'Italic 22'); // Hmmmm
gauge.Set('chart.title.top.font', 'Impact');
gauge.Set('chart.title.top.color', 'white');
gauge.Set('chart.title.top', 'Air Speed');
gauge.Set('chart.title.bottom.size', 'Italic 14'); // Hmmmm
gauge.Set('chart.title.bottom.font', 'Impact');
gauge.Set('chart.title.bottom.color', '#ccc');
gauge.Set('chart.title.bottom', 'Knots');
gauge.Set('chart.title.bottom.pos', 0.4);
gauge.Set('chart.needle.colors', [RGraph.RadialGradient(gauge, 125, 125, 0, 125, 125, 25, 'transparent', 'white'),
RGraph.RadialGradient(gauge, 125, 125, 0, 125, 125, 25, 'transparent', '#d66')]);
//针的颜色。
gauge.Set('chart.needle.size', [null, 50]);
gauge.Set('chart.border.outer', '#666');
gauge.Set('chart.border.inner', '#333');
23、
gauge.canvas.onclick_rgraph = function (e)
{
var obj = e.target.__object__;
var value = obj.getValue(e);
obj.value = value;
RGraph.Effects.Gauge.Grow(obj);
}
gauge.Set('chart.needle.tail', true);//后面的尾巴有不有。
RGraph.HBar
24、
var hbar = new RGraph.HBar('cvs', [5,8,6,4,3,2,1,6,8]);
hbar.Set('chart.labels', ['Venus','Felicity','Cynthia','Frederick','Hoolio','Peter','Jennifer','Richard','Joathan']);
hbar.Draw();
25、
var hprogress = new RGraph.HProgress('cvs', 89,100);
RGraph.Line
26、
var line = new RGraph.Line('cvs', [5,4,1,6,8,5,3]);
27、
line.Set('chart.background.grid.autofit.numvlines', 11);
line.Set('chart.key', ['John']);
line.Set('chart.key.interactive', false);//交互式的
28、
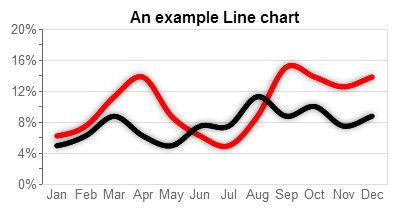
line.Set('chart.curvy', true);//要生成直线还是曲线。
RGraph.Effects.Line.jQuery.Trace(line);
29、
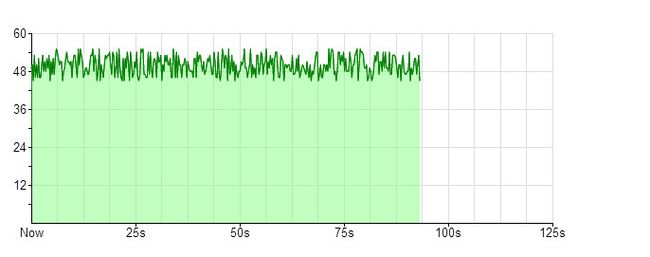
var line = new RGraph.Line('cvs', data);
r = RGraph.random(45,55);
data = [r].concat(data);
data.pop();
30、
31、
RGraph.Effects.Line.jQuery.UnfoldFromCenterTrace(myLine, {'duration': 1000});
RGraph.Meter
32、
var meter = new RGraph.Meter('cvs', 0,100,45);
33、
meter.Set('chart.colors.ranges', [[0,40,'#0c0'], [40,80,'yellow'], [80,100,'red']]);
meter.Set('chart.needle.radius', 130);
RGraph.Odometer
34、
var odo = new RGraph.Odometer('cvs', 0,100,45);//里程表
RGraph.Pie
35、
pie.Set('chart.exploded', [15,25);
36、 setTimeout(function () {pie.Explode(0,10);}, 250);
37、
var pie = new RGraph.Pie('cvs', [4,3,2,6,8]);
RGraph.Effects.Pie.RoundRobin(pie);
38、
pie.Set('chart.tooltips', ['Miscellaneous','Cooking','Office equipment','Refridgeration','Cooling','Ventilation','Lighting']);
pie.Set('chart.tooltips.event', 'onmousemove');
RGraph.Radar
39、
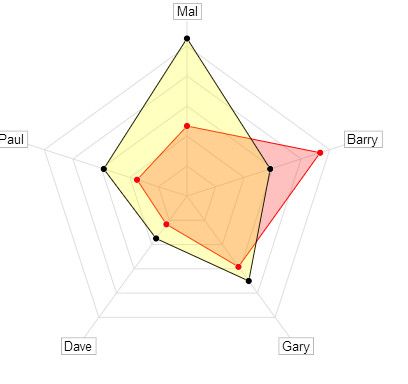
var radar = new RGraph.Radar('cvs', [4,3,8,4,6,7,5]);//雷达
radar.Set('chart.labels', ['Jeff','Luis','Norman','Janice','Bill','Henry','Kev']);
40、
var radar2 = new RGraph.Radar('cvs', [4,8,5,2,3],[9,5,6,3,5]);
RGraph.Rose
41、
var rose = new RGraph.Rose('cvs', [4,6,3,5,2,8,9]);
RGraph.Rscatter
42、
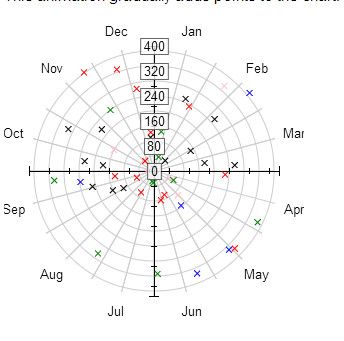
var rscatter = new RGraph.Rscatter('cvs', [
[25,45],[51,23],[132,52],[166,52],[311,5],[322,42],[56,52],[10,20],[355,56],[124,52],
[52,56],[53,12],[225,53],[311,25],[144,52],[133,25]
]);
43、
state.rscatter = new RGraph.Rscatter('cvs', state.data);
for (var i=0; i<50; ++i) {
setTimeout('state.data.push(['+(360 * Math.random())+','+ RGraph.random(0,400) +', ["black","red","blue","green","pink"][RGraph.random(0,5)]]);RGraph.Clear(state.rscatter.canvas);RGraph.Redraw();', 10 * i);
}
Scatter
44、
var scatter = new RGraph.Scatter('cvs', [
[25,45],[51,23],[132,52],[166,52],[311,5],[322,42],[56,52],[10,20],[355,56],[124,52],
[52,56],[53,12],[225,53],[311,25],[144,52],[133,25]
]);
45、
var scatter = new RGraph.Scatter('cvs', [
[30,15, 'red'],
[60,5, 'blue'],
[90,8, 'pink'],
[120,19, 'green'],
[150,14, 'gray'],
[50,12, 'red'],
[180,24, 'gray'],
[250,21, 'black']
]);
bubble = new RGraph.Scatter.Bubble(scatter, 0, // Minimum
100, // Maximum
25, // Max width
[50,60,70,80,90,84,86,87] // Bubble data
);
bubble.Draw();
RGraph.Thermometer
46、
var thermometer = new RGraph.Thermometer('cvs', 0,100,68);
47、
thermometer.Set('chart.tooltips.event', 'onmousemove');
thermometer.Set('chart.tooltips', ["It's getting <b style='color: red'>hot</b> in here!"]);
RGraph.VProgress
48、
var vprogress = new RGraph.VProgress('cvs', 89,100);
Waterfall
49、
var waterfall = new RGraph.Waterfall('cvs', [10,10,5,-2,-5,6,-5,-4]);
50、
From: http://freestyleboy21.blog.163.com/blog/static/208406241201291811363740/


