statsd 五种类型数据发送形式拟测试
StatsD Metric Types
Counting
gorets:1|c
This is a simple counter. Add 1 to the "gorets" bucket. At each flush the current count is sent and reset to 0. If the count at flush is 0 then you can opt to send no metric at all for this counter, by setting config.deleteCounters (applies only to graphite backend). Statsd will send both the rate as well as the count at each flush.
Sampling
gorets:1|c|@0.1
Tells StatsD that this counter is being sent sampled every 1/10th of the time.
Timing
glork:320|ms|@0.1
The glork took 320ms to complete this time. StatsD figures out percentiles, average (mean), standard deviation, sum, lower and upper bounds for the flush interval. The percentile threshold can be tweaked with config.percentThreshold.
The percentile threshold can be a single value, or a list of values, and will generate the following list of stats for each threshold:
stats.timers.$KEY.mean_$PCT
stats.timers.$KEY.upper_$PCT
stats.timers.$KEY.sum_$PCT
Where $KEY is the stats key you specify when sending to statsd, and $PCT is the percentile threshold.
Note that the mean metric is the mean value of all timings recorded during the flush interval whereas mean_$PCT is the mean of all timings which fell into the $PCT percentile for that flush interval. And the same holds for sum and upper. Seeissue #157 for a more detailed explanation of the calculation.
If the count at flush is 0 then you can opt to send no metric at all for this timer, by setting config.deleteTimers.
Use the config.histogram setting to instruct statsd to maintain histograms over time. Specify which metrics to match and a corresponding list of ordered non-inclusive upper limits of bins (class intervals). (use inf to denote infinity; a lower limit of 0 is assumed) Each flushInterval, statsd will store how many values (absolute frequency) fall within each bin (class interval), for all matching metrics. Examples:
- no histograms for any timer (default):
[] -
histogram to only track render durations, with unequal class intervals and catchall for outliers:
[ { metric: 'render', bins: [ 0.01, 0.1, 1, 10, 'inf'] } ] -
histogram for all timers except 'foo' related, with equal class interval and catchall for outliers:
  [ { metric: 'foo', bins: [] },
    { metric: '', bins: [ 50, 100, 150, 200, 'inf'] } ]
Statsd also maintains a counter for each timer metric. The 3rd field specifies the sample rate for this counter (in this example @0.1). The field is optional and defaults to 1.
Note:
- first match for a metric wins.
- bin upper limits may contain decimals.
- this is actually more powerful than what's strictly considered histograms, as you can make each bin arbitrarily wide, i.e. class intervals of different sizes.
Gauges
StatsD now also supports gauges, arbitrary values, which can be recorded.
gaugor:333|g
If the gauge is not updated at the next flush, it will send the previous value. You can opt to send no metric at all for this gauge, by setting config.deleteGauges
Adding a sign to the gauge value will change the value, rather than setting it.
gaugor:-10|g
gaugor:+4|g
So if gaugor was 333, those commands would set it to 333 - 10 + 4, or 327.
Note:
This implies you can't explicitly set a gauge to a negative number without first setting it to zero.
Sets
StatsD supports counting unique occurences of events between flushes, using a Set to store all occuring events.
uniques:765|s
If the count at flush is 0 then you can opt to send no metric at all for this set, by setting config.deleteSets.
Multi-Metric Packets
StatsD supports receiving multiple metrics in a single packet by separating them with a newline.
gorets:1|c\nglork:320|ms\ngaugor:333|g\nuniques:765|s
Be careful to keep the total length of the payload within your network's MTU. There is no single good value to use, but here are some guidelines for common network scenarios:
- Fast Ethernet (1432) - This is most likely for Intranets.
- Gigabit Ethernet (8932) - Jumbo frames can make use of this feature much more efficient.
- Commodity Internet (512) - If you are routing over the internet a value in this range will be reasonable. You might be able to go higher, but you are at the mercy of all the hops in your route.
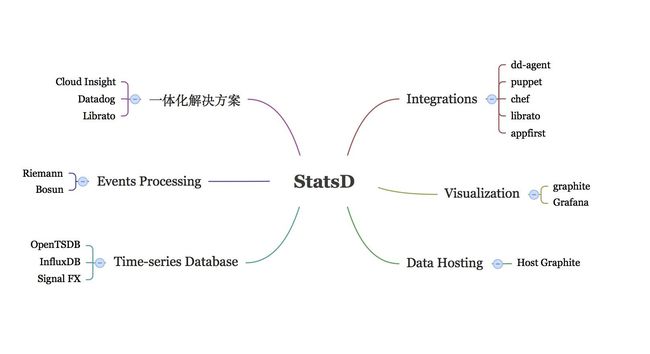
而在国外基于 StatsD 产生了一系列的工具,或者在成熟的项目基础之上,开始兼容 StatsD。如果按照方向可以划分为如图的几个方向。
有了数据和信息可以做很多事,包括数据集成、可视化、可视化+存储、事件流,甚至将这些结合做出一体化解决方案,针对不同的需求,不同的市场,每一个方向都能产生独特价值。接下来我们大致介绍一下这几个方向。
Integrations
StatsD 本身并不负责定义指标的涵义,所以如果要从数据库或者操作系统中采集数据,需要进行脚本的开发。其中在这方面做出突出贡献的是 Datadog。Datadog 开发的 dd-agent 项目在 GitHub 多达 150 个贡献者,兼容 60 多种操作系统、中间件、数据库。
除此之外,Librato 和 App First 也加入到 StatsD 的阵营中。而基础设施管理的解决方案:Puppet 和 Chef 也开始兼容将 StatsD 批量安装到基础设施中。
Visualization & Data Hosting
光有数据是不够的,良好的可视化才能将数据的作用发挥出来。在可视化这一块影响力较大的 Graphite 作为一个可视化的控件,不仅包含可视化还自带存储的部分。但也有不少人反映 Graphite 自带的界面太难看,得益于开源世界的伟大,我们有了 Grafana 可用,直接部署在nginx上面就行,使用node.js 实现的数据抓取。单论可视化,Grafana 是做得最好的一家,其展现形式丰富,可配置项目巨细靡遗。Signal FX 后来居上,也参与到竞争中。
在数据可视化的基础之上,也有服务开始从事可视化数据的托管服务。例如:Host Graphite。
时间序列数据库和事件处理引擎
其实 StatsD 和时间序列数据库的出现,是相辅相成的。在 OpenTSDB 和 InfluxDB 基础之上,StatsD 的应用才日渐丰满。InfluxDB 是一个开源分布式时序、事件和指标数据库,使用 Go 语言编写,无需外部依赖。对于运维工程师而言,OpenTSDB 可以获取基础设施和服务的实时状态信息,展示集群的各种软硬件错误,性能变化以及性能瓶颈。
再说说事件处理引擎,比如 Bosun 是一个新型的监控和告警系统,使用 golfing 编写,支持定义复杂的告警规则,支持 OpenTSDB、Graphite、Logstash-Elasticsearch 等数据源。Riemann 也开始与时间序列数据库,或者基于 StastD 的一体化解决方案对接,来弥补一些数据展现产品在报警这个方向上的不足。
一体化解决方案
那么,有没有能包含数据集成、可视化、数据存储、事件流处理于一体的解决方案呢?对于中小型企业尤其创业公司来说,自主开发或者利用现有的开源工具进行监控或多或少都会遇到一些问题,既要考虑成本又怕踩坑。这时候除开上述细分的方向之外,提供一体化解决方案的厂商及时出现了。国外这样的厂商有 Datadog、Librato 等等。其中 Datadog 在国外拥有 Facebook、Airbnb 等重量级客户,正大展风头。

