建立机器学习系统的20课
Data science is not only a scientific field, but also it requires the art and innovation from time to time. Here, we have compiled wisdom learned from developing data science products for over a decade by Xavier Amatriain.
By Devendra Desale, KDnuggets.
![]() comments
comments
The role of models, big data, data scientist acumen and algorithms in the quest for valuable insight and meaningful results results is never ending. Recently, I came across the presentations by Xavier Amatriain, currently a VP of Engineering at Quora, well known for his work on Recommender Systems and Machine Learning. He has shared these lessons based on his experience working at companies like Netflix & Quora.
1. More datavs. & Better Models
Gross over-generalization of “more data gives better results” is misguiding. There are times when more data helps, and there are times when it doesn’t. There is no denying to the fact that better data means better results. However better doesn’t always imply “more” data. As a matter of fact, sometimes it might mean less! Read more, here.
2. You might not need all your Big Data
“Everybody” has Big Data, but not everybody needs it. E.g. Do you need many millions of users if the goal is to compute a MF of, say, 100 factors? Many times, doing some kind of smart (e.g. stratified) sampling can produce as good or even better results as using it all.
3. The fact that a more complex model does not improve things does not mean you don’t need one
Imagine if you have a linear model and for some time you have been selecting and optimizing features for that model. If you try a more complex (e.g. non-linear) model with the same features you are not likely to see any improvement. If you try to add more expressive features, the existing model is likely not to capture them and you are not likely to see any improvement. More complex features may require a more complex model. A more complex model may not show improvements with a feature set that is too simple.
4. Learn to deal with (The curse of) Presentation Bias
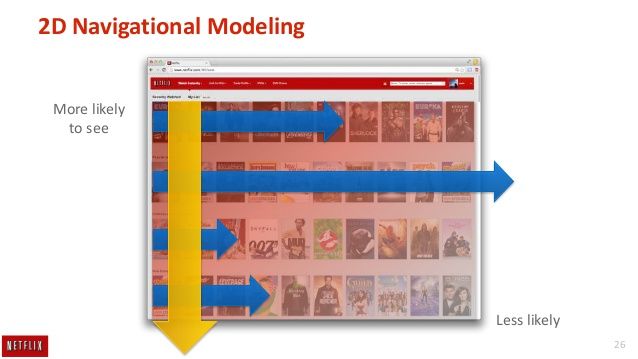
User can only click on what you decide to show. But, what you decide to show is the result of what your model predicted is good. Simply treating things you show as negatives is not likely to work. Better options could be correcting for the probability a user will click on a position known as Attention models also it is good idea to Explore/exploit approaches such as MAB.
5. Be thoughtful about your training data
While building the training and testing data we mindful about the results and different possible scenarios. E.g. Even training a simple binary classifier of a positive or a negative label for user’s liking a movie? We have scenarios like, user watches a movie to completion and rates it 1 star, user watches the same movie again (maybe because she can’t find anything else), user abandons movie after 5 minutes, or 15 minutes or 1 hour. There can be other issues like Time traveling: usage of features that originated after the event you are trying to predict. E.g. Your rating a movie is a pretty good prediction of you watching that movie, especially because most ratings happen AFTER you watch the movie.
6. The UI is the algorithm’s only communication channel with that which matters most: the users
The UI generates the user feedback that we will input into the algorithms. The UI is also where results of our algorithms will be shown. A change in the UI might require a change in algorithms and viceversa.
7. Data and Models are great. You know what’s even better? The right evaluation approach
Executing A/B tests, measure differences in metrics across statistically identical populations that each experience a different algorithm. Decisions on the product are always data-driven. While, Offline testing, measure model performance, using (IR) metrics. Offline performance is used as an indication to make informed decisions on follow-up A/B tests. A critical (and mostly unsolved) issue is how offline metrics can correlate with A/B test results.
8. Distributing algorithms is important, but knowing at what level to do it is even more important
There are three levels of Distribution/Parallelization: First one for each subset of the population (e.g. region). Second is for each combination of the hyperparameters, and last one for each subset of the training data. Each level has different requirements
Pages: 1 2 3
