如何用R生成回归结果Word报告
作者 Klodian Dhana
通过本文我会展示一种将回归结果(或者输出)从R传输到Word的简单方法。 先前我曾写过一个文档,指导大家如何创建一个含有学习特征的表格并将其传输到Word上。而本文非常适合准备把手稿发表于同行评议期刊的研究人员。
建立一个Cox模型
我将计算一个生存分析模型作为例子来演示整个流程。生存分析是一种用来分析事件发生前的等待时间的统计方法。这里的事件指疾病或者死亡等。在R中我们可以利用survival包来进行生存分析,其中的coxph()函数能用来建立Cox模型。我将使用survival包中的veteran数据集来建模。
## 加载survival包
library(survival)

# 加载veteran数据集
data(veteran)

# 显示前6行
head(veteran)
  trt celltype time status karno diagtime age prior
1   1 squamous   72      1    60        7  69     0
2   1 squamous  411      1    70        5  64    10
3   1 squamous  228      1    60        3  38     0
4   1 squamous  126      1    60        9  63    10
5   1 squamous  118      1    70       11  65    10
6   1 squamous   10      1    20        5  49     0

# 数据表述
help(veteran, package="survival")

trt:    1=standard 2=test
celltype:   1=squamous, 2=smallcell, 3=adeno, 4=large
time:   survival time
status: censoring status
karno:  Karnofsky performance score (100=good)
diagtime:   months from diagnosis to randomisation
age:    in years
prior:  prior therapy 0=no, 1=yes
我们所关心的是不同细胞类型(celltype),不同的处置方式(trt)对死亡风险(status)的影响,其他变量(karno,age, prior)只是控制变量。
模型如下:
# 建立Cox模型
fit = coxph(Surv(time, status) ~ age + celltype + prior + karno + diagtime + trt, data=veteran)
输出如下:
summary(fit)
Call:
coxph(formula = Surv(time, status) ~ age + celltype + prior +
karno + diagtime + trt, data = veteran)
n= 137, number of events= 128
coef exp(coef) se(coef) z Pr(>|z|)
age -8.706e-03 9.913e-01 9.300e-03 -0.936 0.34920
celltypesmallcell 8.616e-01 2.367e+00 2.753e-01 3.130 0.00175 **
celltypeadeno 1.196e+00 3.307e+00 3.009e-01 3.975 7.05e-05 ***
celltypelarge 4.013e-01 1.494e+00 2.827e-01 1.420 0.15574
prior 7.159e-03 1.007e+00 2.323e-02 0.308 0.75794
karno -3.282e-02 9.677e-01 5.508e-03 -5.958 2.55e-09 ***
diagtime 8.132e-05 1.000e+00 9.136e-03 0.009 0.99290
trt 2.946e-01 1.343e+00 2.075e-01 1.419 0.15577
Signif. codes: 0 ‘***’ 0.001 ‘**’ 0.01 ‘*’ 0.05 ‘.’ 0.1 ‘ ’ 1
exp(coef) exp(-coef) lower .95 upper .95
age 0.9913 1.0087 0.9734 1.0096
celltypesmallcell 2.3669 0.4225 1.3799 4.0597
celltypeadeno 3.3071 0.3024 1.8336 5.9647
celltypelarge 1.4938 0.6695 0.8583 2.5996
prior 1.0072 0.9929 0.9624 1.0541
karno 0.9677 1.0334 0.9573 0.9782
diagtime 1.0001 0.9999 0.9823 1.0182
trt 1.3426 0.7448 0.8939 2.0166
Concordance= 0.736 (se = 0.03 )
Rsquare= 0.364 (max possible= 0.999 )
Likelihood ratio test= 62.1 on 8 df, p=1.799e-10
Wald test = 62.37 on 8 df, p=1.596e-10
Score (logrank) test = 66.74 on 8 df, p=2.186e-11
我们发现利用summary函数会输出“一大堆”结果。但在文章中我们经常只汇报风险率(Hazard ratio),95%的置信区间和一些我们感兴趣的变量。比如在这个例子中,我对细胞类型和处置效应感兴趣。注:我不对回归系数做解释因为这并不是本文的重点。
为结果输出表设定列
# 构造表格的列
HR <- round(exp(coef(fit)), 2)
CI <- round(exp(confint(fit)), 2)
P <- round(coef(summary(fit))[,5], 3)

# 给CI的列命名
colnames(CI) <- c("Lower", "Higher")

# 将列合并为数据框
table2 <- as.data.frame(cbind(HR, CI, P))
table2
                   HR Lower Higher     P
age               0.99  0.97   1.01 0.349
celltypesmallcell 2.37  1.38   4.06 0.002
celltypeadeno     3.31  1.83   5.96 0.000
celltypelarge     1.49  0.86   2.60 0.156
prior             1.01  0.96   1.05 0.758
karno             0.97  0.96   0.98 0.000
diagtime          1.00  0.98   1.02 0.993
trt               1.34  0.89   2.02 0.156
从表中选择感兴趣的变量
正如我先前所提,我只对两个变量感兴趣(cellytpe, trt)。通过下面的代码我将这两个变量的结果提取出来。
# 把你想在表中呈现的变量选出来
table2 <- table2[c("celltypesmallcell", "celltypeadeno", "celltypelarge", "trt"),]
table2
                    HR Lower Higher     P
celltypesmallcell 2.37  1.38   4.06 0.002
celltypeadeno     3.31  1.83   5.96 0.000
celltypelarge     1.49  0.86   2.60 0.156
trt               1.34  0.89   2.02 0.156
设定表的格式
在文章中我们需要把置信区间用圆括号括起来,因而利用下面的代码添加圆括号。
# 添加表中要用到的圆括号和连接符
table2$a <- "("; table2$b <- "-"; table2$c <- ")"

# 给列重新排序
table2 <- table2[,c("HR","a","Lower","b","Higher","c", "P")]
table2
                    HR a Lower b Higher c     P
celltypesmallcell 2.37 (  1.38 -   4.06 ) 0.002
celltypeadeno     3.31 (  1.83 -   5.96 ) 0.000
celltypelarge     1.49 (  0.86 -   2.60 ) 0.156
trt               1.34 (  0.89 -   2.02 ) 0.156
对表格进行传输到Word前的最后处理
万事俱备,我们只需要利用tidyr包的unite()函数把整个表格合并为一列就可以了。
# 合并所有列
library(tidyr)
table2 = unite(table2, "HR (95%CI)", c(HR, a, Lower, b, Higher, c), sep = "", remove=T)
# 在HR和CI的估计值之间添加空格
table2[,1] <- gsub("\\(", " (", table2[,1])
table2
                        HR (95%CI)     P
celltypesmallcell 2.37 (1.38-4.06) 0.002
celltypeadeno     3.31 (1.83-5.96) 0.000
celltypelarge      1.49 (0.86-2.6) 0.156
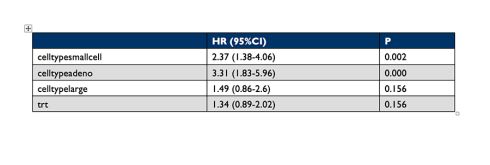
trt               1.34 (0.89-2.02) 0.156
将表格由R传输到Word
我将使用ReporteRs包的FlexTable()函数将表格由R传输到Word。我在StackOverflow里发现了一个非常棒的脚本来实现这个任务。我把相应的代码放在下面。(由衷感谢StackOverflow上的作者)
# 加载包
library(ReporteRs)
library(magrittr)

# 脚本
docx( ) %>%
     addFlexTable(table2 %>%
               FlexTable(header.cell.props = cellProperties( background.color = "#003366"),
                    header.text.props = textBold(color = "white"),
                    add.rownames = TRUE ) %>%
               setZebraStyle(odd = "#DDDDDD", even = "#FFFFFF")) %>%
     writeDoc(file = "table2.docx")
输出到Word的表格是这个样子的

如果你有任何建议和意见,请在下方留言。
注:原文刊载于datascience+网站
链接:http://datascienceplus.com/how-to-export-regression-results-from-r-to-ms-word/
