Regression的 应用-预测房价
概要:
一、Jupyter的使用
二、
一、使用jupyter
1、启动
ipython notebook
导入graphlab
import graphlab as gl加载数据
sf=gl.SFrame('home_data.gl')
显示
sf.show()
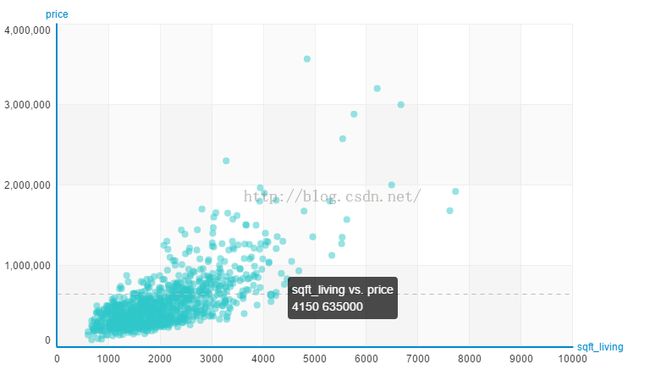
sf.show(view="Scatter Plot",x="sqft_living",y="price")

如下面这样,就可以将plot显示在notebook上
gl.canvas.set_target('ipynb')
sf.show(view="Scatter Plot",x="sqft_living",y="price")
划分数据集:训练与测试集为8:2
train_data,test_data=sf.random_split(.8,seed=0)
从单个特征中学习回归模型
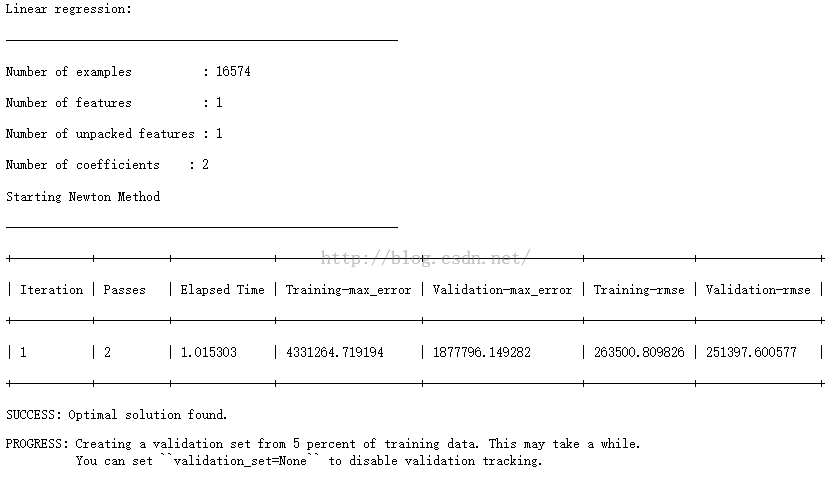
sqft_model=gl.linear_regression.create(train_data,target='price',features=['sqft_living'])

计算均方根误差(RMSE)
print sqft_model.evaluate(test_data)
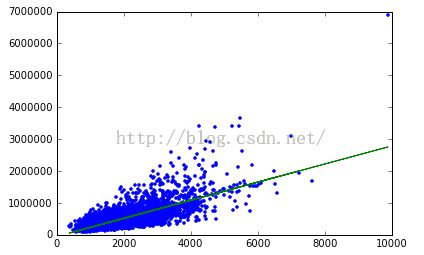
可视化模型
plt.plot(test_data['sqft_living'],test_data['price'],'.',
        test_data['sqft_living'],sqft_model.predict(test_data),'-')

查看学习曲线的参数
sqft_model.get('coefficients')

得到y=wx+b中w和数值
使用其他特征
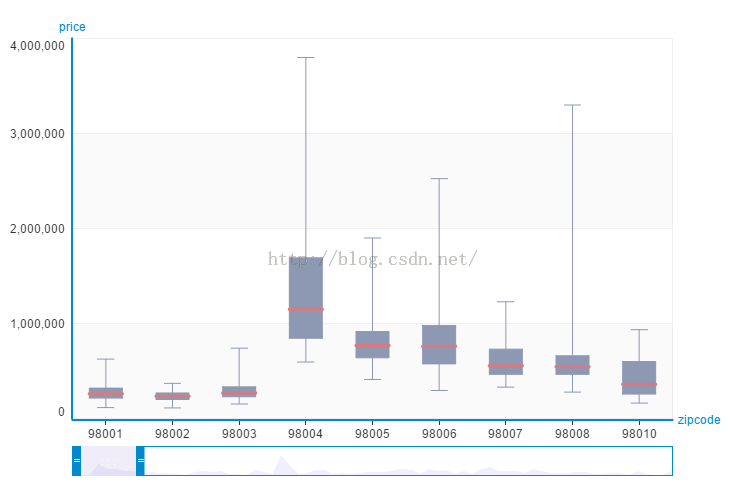
sf.show(view='BoxWhisker Plot',x='zipcode',y='price')

my_features_model=gl.linear_regression.create(train_data,target='price',features=my_features)
比较两个模型的均方根误差
print sqft_model.evaluate(test_data)
print my_features_model.evaluate(test_data)
明显可以看到多个特征拟合的学习曲线明显好于单特征的学习曲线
查看单个房屋的资料
house=sf[sf['id']=='5309101200']
应用模型预测平均房价
print sqft_model.predict(house)
print my_features_model.predict(house)
结果如下
在新样本中测试模型