javaEE SSH框架使用ChartDirector绘图
最近做毕设想要在web端显示图表,网上有很多图表的插件,JFreeChart也不错,不过我选择的是ChartDirector。
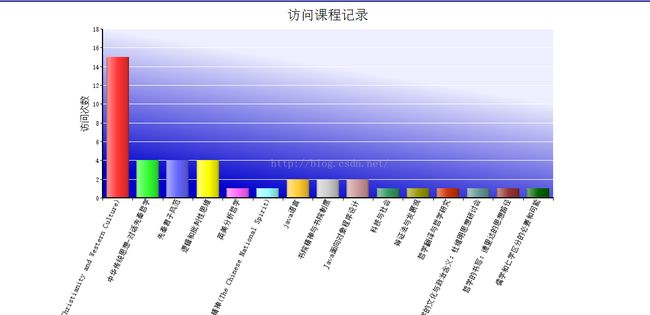
一、需求:分页显示学生访问对应课程次数的柱状图,(之前我爬取了网站上的一些课程,并记录了用户访问的记录)
二、实现:
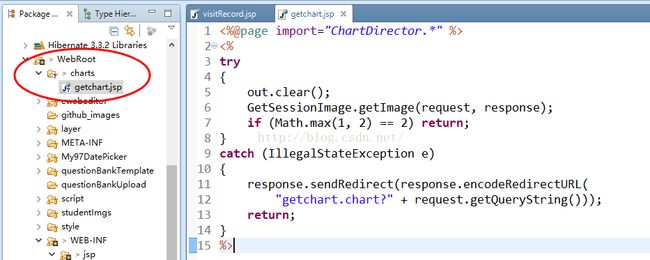
(1)ChartDirector自带一个jsp文件,复制到项目中,还有将ChartDirector.jar包引入项目中
(2)要显示图表的jsp界面,其中chart1URL和imageMap1是Action层处理好传递过来的数据,分页的代码可以忽略掉,其实真实的界面代码也就几行。
<%@ page language="java" import="java.util.*" pageEncoding="UTF-8"%>
<!DOCTYPE HTML PUBLIC "-//W3C//DTD HTML 4.01 Transitional//EN">
<html>
  <head>
  	<%@include file="/WEB-INF/jsp/public/list.jspf" %>
    <meta http-equiv="Content-Type" content="text/html; charset=UTF-8">
    <title>我的历史浏览记录</title>
  </head>

  <body>
  	<div align="center">
	<hr color="#000080">
	<img src='${pageContext.request.contextPath}/charts/getchart.jsp?${chart1URL}' usemap="#map1" border="0">
	<map name="map1">${imageMap1}</map>
	</div>
	<s:form name="student_visitRecord" method="post" >
	</s:form>
<!-- 分页 -->
	<div class="pageView" style="font-size:20px;">
页次:${currentPage}/${pageCount}  每页:${pageSize}条
总记录条数:${recordCount}
<a href="javascript: gotoPage(1)" title="首页" style="cursor: hand;">首页</a>
<s:iterator begin="%{beginPageIndex}" end="%{endPageIndex}" var="num">
	<s:if test="#num == currentPage">
		<%-- 当前页 --%>
		<span class="PageSelectorSelected">${num}</span>
	</s:if>
	<s:else>
		<%-- 非当前页 --%>
		<span class="PageSelectorNum" onClick="gotoPage(${num});">${num}</span>
	</s:else>
</s:iterator>
<a href="javascript: gotoPage(${pageCount})" title="尾页"
	style="cursor: hand;">尾页</a>
转到:
<select onchange="gotoPage(this.value)" id="_pn">
	<s:iterator begin="1" end="%{pageCount}" var="num">
		<option value="${num}">${num}</option>
	</s:iterator>
</select>
<script type="text/javascript">
	$("#_pn").val("${currentPage}");
</script>

<script type="text/javascript">
	function gotoPage( pageNum ){
		// window.location.href = "forum_show.action?id=${id}&pageNum=" + pageNum;

		$(document.forms[0]).append("<input type='hidden' name='pageNum' value='" + pageNum +"'>");
		document.forms[0].submit();
	}
</script>
</div>
  </body>
</html>
(3)Action层,一些注释已经标注上,乱码的问题设置默认文字c.setDefaultFonts("simsun.ttc"),分页查询的方法就不多说了,将得到chart1URL和imageMap1字符串返回给jsp界面
/** 浏览记录 */
	public String visitRecord() throws Exception{
		int i,recordCount=0;
		//取出学生
		Student stuFind=getCurrentUser().getStudent();
		//取出访问的课程
		String hql="FROM VisitCourseRecord WHERE student=?";
		List<Object> parameters=new ArrayList<Object>();
		parameters.add(stuFind);
		int s=parameters.size();
		PageBean pageBean=visitCourseRecordService.getPageBean(pageNum, 15, hql, parameters);

		List<VisitCourseRecord> courseList=pageBean.getRecordList();
		ActionContext.getContext().getValueStack().push(pageBean);

		//记录条数
		recordCount=courseList.size();
		//数据--显示访问记录数
		double[] count=new double[courseList.size()];
		for(i=0;i<recordCount;i++){
			count[i]=courseList.get(i).getCount();
		}
		//数据--要显示的标题
		String[] labels = new String[courseList.size()];
		for(i=0;i<recordCount;i++){
			labels[i]=courseList.get(i).getSpiderCourse().getName();
		}
		// 创建1000*800的chart
		XYChart c = new XYChart(1000, 800);
		c.setDefaultFonts("simsun.ttc");
		// 添加图形的标题 ---- 18pt 宋体
		c.addTitle("访问课程记录", "宋体", 18);
		// Set the plotarea at (60, 40) and of size 500 x 280 pixels. Use a vertical gradient color from
		// light blue (eeeeff) to deep blue (0000cc) as background. Set border and grid lines to white
		// (ffffff).
		c.setPlotArea(100, 40, 800, 300, c.linearGradientColor(100, 40, 60, 280, 0xeeeeff, 0x0000cc), -1,
		    0xffffff, 0xffffff);
		// Add a multi-color bar chart layer using the supplied data. Use soft lighting effect with light
		// direction from left.
		c.addBarLayer3(count).setBorderColor(Chart.Transparent, Chart.softLighting(Chart.Left));
		// 设置文字
		c.xAxis().setLabels(labels);
		//设置文字以及方向65度
		c.xAxis().setLabelStyle("宋体", 10).setFontAngle(65);
		// Draw the ticks between label positions (instead of at label positions)
		c.xAxis().setTickOffset(0.5);
		// Add a title to the y axis with 10pt Arial Bold font
		c.yAxis().setTitle("访问次数","宋体",12);
		// Set axis line width to 2 pixels
		c.xAxis().setWidth(2);
		c.yAxis().setWidth(2);
		// Output the chart
		String chart1URL = c.makeSession(ServletActionContext.getRequest(), "chart1");
		// Include tool tip for the chart
		String imageMap1 = c.getHTMLImageMap("", "", "title='{xLabel}: US$ {value}M'");

		ActionContext.getContext().put("chart1URL", chart1URL);
		ActionContext.getContext().put("imageMap1", imageMap1);
		return "visitRecord";
	}
(4)其他就是SSH框架的东西,这里就不说了
三、测试:
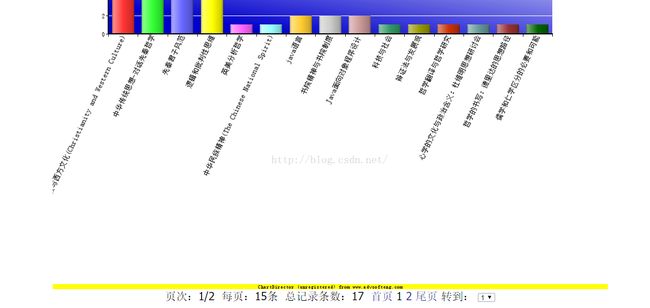
分页信息:
下面黄色的标识是ChartDirector本身带的,网上有破解的方法,版本的原因,这里不再给出。
四、总结
刚开始ChartDirector给的jsp显示图表的Demo都是写在jsp界面的java代码,一些准备数据的代码,就可以移到Action或其他处理的代码中,只需要提供img的src的url和map的值即可。还有中文乱码问题,也是在网上搜到一些解决方法,关于其中的设置还要不断使用熟悉。


