MPAndroidChart 教程:设置数据,设置颜色(四)
其余文章索引:
MPAndroidChart 教程:概述
MPAndroidChart 教程:开始 Getting Started(一)
MPAndroidChart 教程:与图表进行手势交互 Interaction with the Chart(二)
MPAndroidChart 教程:坐标轴,X轴,Y轴,Labels(三)
MPAndroidChart 教程:设置数据,设置颜色(四)
MPAndroidChart 教程:数据格式器 ValueFormatter(五)
MPAndroidChart 教程:图表的具体设置 Specific chart settings(六)
MPAndroidchart 教程:图例 Legend(七)
MPAndroidChart 教程:动态和实时数据 Dynamic & Realtime Data(八)
MPAndroidChart 教程:修改视窗 Modifying the Viewport(九)
MPAndroidChart 教程:动画 Animations(十)
MPAndroidChart 教程:MarkerView(十一)
MPAndroidChart 教程:ChartData类,ChartData子类, DataSet类,DataSet子类(十二)
时间仓促,难免有错误,有的话希望大家在评论中指出,谢谢。
源码:范例代码在线查看或下载
一、ChartData 类
为了让大家更容易理解,这里先简单介绍下 MPAndroidChart 的数据模型 ChartData 。后面有文章再详细介绍该图标库的其它数据类型。
ChartData 类是所有数据类的基类,比如 LineData,BarData 等,它是用来为 Chart 提供数据的,通过 setData(ChartData data){...} 方法。
public class LineData extends ChartData { ...以下提到的方法是在 ChartData 类中被实现,因此可用于所有子类。
1. Styling data
setDrawValues(boolean enabled): 启用/禁用 绘制所有DataSets数据对象包含的数据的值文本。setValueTextColor(int color): 设置DataSets数据对象包含的数据的值文本的颜色。setValueTextSize(float size): 设置DataSets数据对象包含的数据的值文本的大小(单位是dp)。
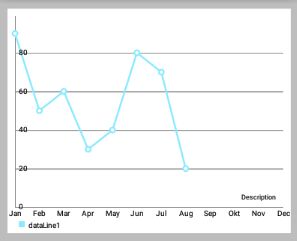
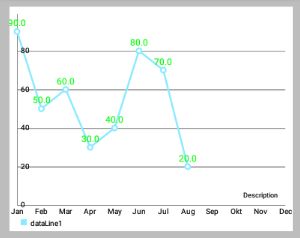
    //LineDataSet可以看做是一条线
    LineDataSet dataSet = new LineDataSet(entryList, "dataLine");
    dataSet.setLineWidth(2.5f);
    dataSet.setCircleSize(4.5f);
    dataSet.setHighLightColor(Color.RED); // 设置点击某个点时,横竖两条线的颜色
    dataSet.setDrawValues(true); // 是否在点上绘制Value
    dataSet.setValueTextColor(Color.GREEN);
    dataSet.setValueTextSize(12f);
allLinesList.add(dataSet); dataSet.setValueTextSize(24f);
allLinesList.add(dataSet);
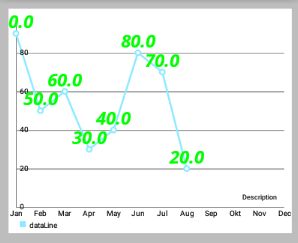
// 设置上面左图的字体
Typeface tf1 = Typeface.createFromAsset(getAssets(), "OpenSans-BoldItalic.ttf");
dataSet.setValueTypeface(tf1);
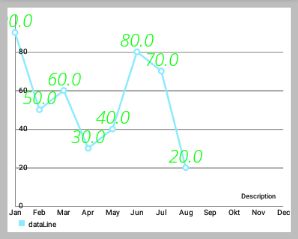
// 设置上面右图的字体
Typeface tf2 = Typeface.createFromAsset(getAssets(), "OpenSans-LightItalic.ttf");
dataSet.setValueTypeface(tf2);setValueFormatter(ValueFormatter f): 为DataSets数据对象包含的数据设置自定义的ValueFormatter。
2. Getters / Convenience
getDataSetByIndex(int index): 返回目标DataSet列表中给定索引的数据对象。contains(Entry entry): 检查此数据对象是否包含指定的Entry 。 注:这个相当影响性能,性能严峻情况下,不要过度使用。contains(T dataSet): Returns true if this data object contains the provided DataSet , false if not.
3. Clear
clearValues(): 清除所有DataSet对象和所有Entries的数据 。 不会删除所提供的x-values。
4, 选中高亮
setHighlightEnabled(boolean enabled): 设置为true,允许通过点击高亮突出ChartData对象和其DataSets。
二、设置数据
1. 概述
如果你想为图表添加数据,你可以通过下面这个方法:
public void setData(ChartData data) { ... }基类 ChartData 封装了渲染过程中所需要的图表中的所有数据和信息。 对于每种类型的图表,不同的 ChartData 子类(例如 LineData)应该被用于为图表设置数据。 在构造函数中,你可以通过 ArrayList<? extends DataSet> 作为要显示的值,一个额外 ArrayList 的 String 用来描述 x 轴上的标签。 例如,通过 LineData 将数据添加到一个 LineChart :
    // this is just one of many constructors
public LineData(ArrayList<String> xVals, ArrayList<LineDataSet> sets) { ... }那么,DataSet 到底是什么和为什么你会需要它? 很简单,一个 DataSet 对象代表一组 entries(数据类型 Entry),在图表内属于一个整体。 它在图表中被设计成 逻辑上分离的不同组的值 。 每种类型的图表,通过一个不同的 DataSet 对象(如 LineDataSet)来做出特定的 style 。
2. 举个例子
你可能想用 LineChart 来 显示两个不同公司一年的季度收入 。在这种情况下,将建议创建两个不同的 LineDataSet 对象,每个包含四个值(四个季度)。 用一个 ArrayList 描述在x轴上的标签,您只需提供四个 String : “第一季度”,“第二季度”,“第三季度”,“第四季度” 。
当然,也有可能只提供一个包含两个公司的所有8个值的 LineDataSet 对象。
那么,如何建立一个 LineDataSet 对象?
// LineDataSet 类的源码
public class LineDataSet extends LineRadarDataSet<Entry> {
    ....
    public LineDataSet(List<Entry> yVals, String label) {
        super(yVals, label);

        // mCircleSize = Utils.convertDpToPixel(4f);
        // mLineWidth = Utils.convertDpToPixel(1f);

        mCircleColors = new ArrayList<Integer>();

        // default colors
        // mColors.add(Color.rgb(192, 255, 140));
        // mColors.add(Color.rgb(255, 247, 140));
        mCircleColors.add(Color.rgb(140, 234, 255));
    }
    ....
}
在构造函数中,很明显 LineDataSet 需要一个 Entry 的 ArrayList 参数,和一个 String 参数作为 图例 (Legend)的 label 来描述 LineDataSet 。 此外, this label can be used to find the LineDataSet amongst other LineDataSet objects in the LineData object.
该 Entry 类型的 ArrayList 封装了图表所有的值。 Entry 相当一个容器,用来封装并保存“一对值”,and it’s position on the x-axis ( the index inside the ArrayList of String of the LineData object the value is mapped to ) :
public Entry(float val, int xIndex) { ... }3. 还是用之前的例子
以前面提到的(这两家公司一年的季度营收)为例:
0) 总的数据包含和操作类似:
// 假设是为 LineChart 设置数据,数据操作顺序大概如下:
new Entry(float val, int xIndex);
new ArrayList<Entry>();

new LineDataSet(ArrayList<Entry> , "label");
new ArrayList<LineDataSet>();

new LineData(List<String> xVals, List<LineDataSet> dataSets));
chart.setData(LineData);
// 详细步骤继续往下看
1) 首先,创建类型的列表Entry ,将保留您的值:
    ArrayList<Entry> valsComp1 = new ArrayList<Entry>();
    ArrayList<Entry> valsComp2 = new ArrayList<Entry>();
2) 然后,给 lists 集合添加 Entry 对象。
确保 Entry 对象包含的 index 都是正确的 (对于x轴来说)。
    Entry c1e1 = new Entry(100.000f, 0); // 0 == quarter 1
    valsComp1.add(c1e1);
    Entry c1e2 = new Entry(50.000f, 1);  // 1 == quarter 2 ...
    valsComp1.add(c1e2);
    // and so on ...

    Entry c2e1 = new Entry(120.000f, 0); // 0 == quarter 1
    valsComp2.add(c2e1);
    Entry c2e2 = new Entry(110.000f, 1); // 1 == quarter 2 ...
    valsComp2.add(c2e2);
    //...
3) 现在,有了 Entry 对象的 lists 集合,再创建 LineDataSet 对象:
    LineDataSet setComp1 = new LineDataSet(valsComp1, "Company 1");
    setComp1.setAxisDependency(AxisDependency.LEFT);
    LineDataSet setComp2 = new LineDataSet(valsComp2, "Company 2");
    setComp2.setAxisDependency(AxisDependency.LEFT);
通过调用 setAxisDependency(...) 使得 DataSet 对应指定轴,进行绘制。
4) 通过 DataSets 集合和 x-axis entries 集合,来创建我们的 ChartData 对象:
// public LineData(List<String> xVals, List<LineDataSet> dataSets) {
// super(xVals, dataSets);
// }

    ArrayList<LineDataSet> dataSets = new ArrayList<LineDataSet>();
    dataSets.add(setComp1);
    dataSets.add(setComp2);

    ArrayList<String> xVals = new ArrayList<String>();
    xVals.add("1.Q"); xVals.add("2.Q"); xVals.add("3.Q"); xVals.add("4.Q");

    LineData data = new LineData(xVals, dataSets);
    mLineChart.setData(data);
mLineChart.invalidate(); // refresh- 调用
invalidate()后图表被刷新,所提供的数据重新绘制。
三、设置颜色
1. ColorTemplate 类简介
- Class that holds predefined color integer arrays (e.g. ColorTemplate.VORDIPLOM_COLORS) and convenience methods for loading colors from resources.
该类封装有 预定义的颜色整数数组(例如ColorTemplate.VORDIPLOM_COLORS)和便利的从资源加载颜色的方法。 ColorTemplate类的源码
public class ColorTemplate {

    /** * an "invalid" color that indicates that no color is set */
    public static final int COLOR_NONE = -1;

    /** * this "color" is used for the Legend creation and indicates that the next * form should be skipped */
    public static final int COLOR_SKIP = -2;

    /** * THE COLOR THEMES ARE PREDEFINED (predefined color integer arrays), FEEL * FREE TO CREATE YOUR OWN WITH AS MANY DIFFERENT COLORS AS YOU WANT */
    public static final int[] LIBERTY_COLORS = {
            Color.rgb(207, 248, 246), Color.rgb(148, 212, 212), Color.rgb(136, 180, 187),
            Color.rgb(118, 174, 175), Color.rgb(42, 109, 130)
    };
    public static final int[] JOYFUL_COLORS = {
            Color.rgb(217, 80, 138), Color.rgb(254, 149, 7), Color.rgb(254, 247, 120),
            Color.rgb(106, 167, 134), Color.rgb(53, 194, 209)
    };
    public static final int[] PASTEL_COLORS = {
            Color.rgb(64, 89, 128), Color.rgb(149, 165, 124), Color.rgb(217, 184, 162),
            Color.rgb(191, 134, 134), Color.rgb(179, 48, 80)
    };
    public static final int[] COLORFUL_COLORS = {
            Color.rgb(193, 37, 82), Color.rgb(255, 102, 0), Color.rgb(245, 199, 0),
            Color.rgb(106, 150, 31), Color.rgb(179, 100, 53)
    };
    public static final int[] VORDIPLOM_COLORS = {
            Color.rgb(192, 255, 140), Color.rgb(255, 247, 140), Color.rgb(255, 208, 140),
            Color.rgb(140, 234, 255), Color.rgb(255, 140, 157)
    };

    /** * Returns the Android ICS holo blue light color. * * @return */
    public static int getHoloBlue() {
        return Color.rgb(51, 181, 229);
    }

    /** * turn an array of resource-colors (contains resource-id integers) into an * array list of actual color integers * * @param r * @param colors an integer array of resource id's of colors * @return */
    public static List<Integer> createColors(Resources r, int[] colors) {

        List<Integer> result = new ArrayList<Integer>();

        for (int i : colors) {
            result.add(r.getColor(i));
        }

        return result;
    }

    /** * Turns an array of colors (integer color values) into an ArrayList of * colors. * * @param colors * @return */
    public static List<Integer> createColors(int[] colors) {

        List<Integer> result = new ArrayList<Integer>();

        for (int i : colors) {
            result.add(i);
        }

        return result;
    }
}- 当时自从 MPAndroidChart V1.4.0 之后,
ColorTemplate这个类就不再重要了。我们可以直接通过DataSet对象进行指定颜色,从而可以区分每个DataSet的 Style 。
2. 举例说明
还是用公司季度营收的例子,我们有两个不同的 LineDataSet 代表两家公司,为此我们现在要设置不同的颜色。
我们希望:
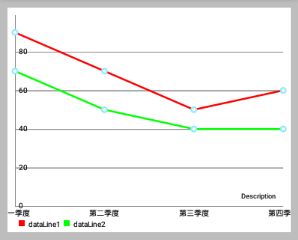
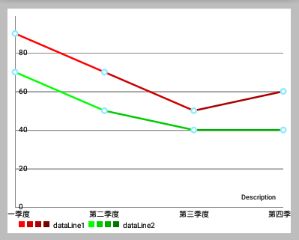
- “公司1” 的颜色用四种不同变化“红”来表示
- “连队2” 的颜色用四种不同变化“绿”来表示
- (效果如下面效果图的右图,左图是单色的)
    ArrayList<LineDataSet> allLinesList = new ArrayList<LineDataSet>();
    //LineDataSet可以看做是一条线
    LineDataSet dataSet1 = new LineDataSet(entryList1, "dataLine1");
    LineDataSet dataSet2 = new LineDataSet(entryList2, "dataLine2");

    // 上面左效果图的代码
    // dataSet1.setColor(Color.RED);
    // dataSet2.setColor(Color.GREEN);

    // sets colors for the dataset,
    // resolution of the resource name to a "real" color is done internally
    dataSet1.setColors(new int[]{R.color.red1, R.color.red2, R.color.red3,
        R.color.red4}, context);
    dataSet2.setColors(new int[]{R.color.green1, R.color.green2, R.color.green3,
        R.color.green4}, context);

    allLinesList.add(dataSet1);
    allLinesList.add(dataSet2);

    List<String> quarterStrs = new ArrayList<String>();
    quarterStrs.add("第一季度");
    quarterStrs.add("第二季度");
    quarterStrs.add("第三季度");
    quarterStrs.add("第四季度");
    //LineData表示一个LineChart的所有数据(即一个LineChart中所有折线的数据)
    LineData mChartData = new LineData(quarterStrs, allLinesList);
除此之外,还有很多其他的方法来设置 DataSet 的颜色 。 下面是完整的文档:
setColors(int [] colors, Context c): 设置该 DataSet 的颜色。
您可以使用new int[] {R.color.red,R.color.green,...}使得颜色值可以重用。 在内部,颜色是使用getResources().getColor(...)来实现获取的。setColors(int [] colors): 设置该 DataSet 的颜色。Colors are reused as soon as the number of Entries the DataSet represents is higher than the size of the colors array. Make sure that the colors are already prepared (by callinggetResources().getColor(...))before adding them to the DataSet.setColors(ArrayList<Integer> colors): 设置该 DataSet 的颜色。Sets the colors that should be used fore this DataSet. Colors are reused as soon as the number of Entries the DataSet represents is higher than the size of the colors array. Make sure that the colors are already prepared (by callinggetResources().getColor(...))before adding them to the DataSet.setColor(int color): 设置该数据集 唯一的颜色。 在内部,实现方式类似上面的”颜色数组”,只不过”颜色数组都是同一种颜色”
3. ColorTemplate 的使用例子:
LineDataSet set = new LineDataSet(...);
set.setColors(ColorTemplate.VORDIPLOM_COLORS);- 如果没有为
DataSet设置颜色,则使用默认颜色。
