分类数据的可视化(mosaic)
谢益辉的《现代统计图形》的电子版在网络上已经受到欢迎并流行开来,国内统计图形方面的书并不多见,这本书算是填补一点空白。我对书中马赛克图形的颇感兴趣,闲来无事便也翻阅了一些文献,发现Michael Friendly做了大量的研究工作。下面是主要基于R和SAS软件的研究简记。
1.“Advances in Visualizing Categorical Data Using the vcd,gnm and vcdExtra Packages in R”
该文以幻灯片形式展现了分类数据的可视化,其中的主要工具是R软件中的vcd、gnm、vcdExtra包。例如在安装上述程序包后,利用其中的数据进行不同模型拟合并作出相应马赛克图:
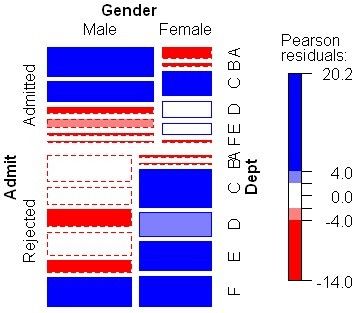
a.变量相互独立(Mutual independence model)
berk.mod0<-loglm(~Dept+Gender+Admit,data=UCBAdmissions)
mosaic(berk.mod0,gp=shading_Friendly)
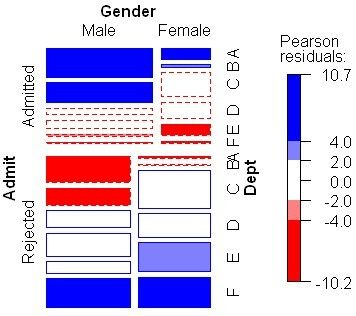
b.联合独立模型(joint independence model)
berk.mod1<-loglm(~Admit+(Gender*Dept),data=UCBAdmissions)
mosaic(berk.mod1,gp=shading_Friendly)
c.文章还提及条件独立模型(Conditional independencemodel)、对数线性模型和广义线性模型(Loglinear models and generalized linear models)、广义非线性模型(Generalized nonlinearmodels)、有序分类模型(Models for ordered categories)等等。该文以简明例子的形式展现各种马赛克图形,生动易懂。
2.利用sas作分类数据可视化研究
与R中存在相应的R包类似,我们也可以借助SAS中也有一些宏程序作马赛克图(站在巨人的肩膀上的结果)。《Visualizing Categorical Data》一书中有详细的阐述,另外该书作者Michael Friendly主页上也有相关数据和宏代码。这类宏主要有:
ADDVAR ( variable plots for logistic regression)、AGREE (Observer agreement chart(SAS/IML))、BIPLOT (Generalized biplot displays)、CATPLOT( Plot results from PROC CATMOD)、CORRESP (Plot PROC CORRESP results)、DISTPLOT (Plots for discrete distributions)、DUMMY (Create dummy variables)、FOURFOLD (Fourfold displays for 2*2*k tables(SAS/IML))、GOODFIT (Goodness-of-fit for discrete distributions)、HALFNORM (Half-normal plots for generalized linear models)、INFLGLIM (Influence plots for generalized linear models)、INFLOGIS (Influence plots for logistic regression)、LAGS(Calculate lagged frequencies fors equential analysis)、LOGODDS (Plot empirical logits for binary data)、MOSAIC (Mosaic displays(macro))、MOSAICS( SAS/IML modules for mosaic displays)MOSMAT (Mosaic matrices(macro))、ORDPLOT (Ordplot for discrete distributions)、PANELS (Arrange multiple plots in apanelled display)、
POISPLOT (Poissonness plot)、POWERLOG (Power calculations for logistic regression)、POWERRxC (Power calculations for two-way frequency table)、
POWER2x2 (Power calculations for a 2*2 table)、ROBUST (Robust fitting for linear models)、ROOTGRAM (Hanging rootograms)、SIEVE (Sieve diagrams(SAS/IML))、SORT (Sort a dataset by a statistic or formatted value)、TABLE (Construct a grouped frequency table,with recoding)、TRIPLOT (Trilinear plots for n*3 tables)、最后是通用的作图宏函数 (Graphics utility macros),主要有: BARS, EQUATE, GDISPLA,GENSYM, GSKIP, LABEL, POINTS, PSCALE.
以上宏代码可以在http://www.datavis.ca/books/vcd/下载到。

