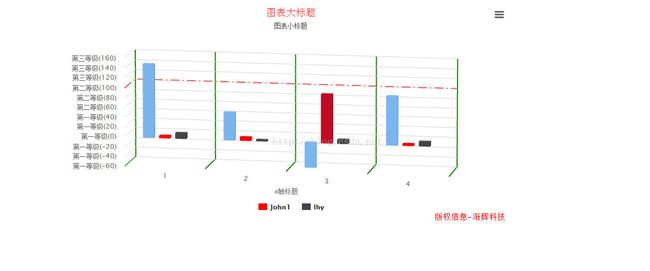
Highcharts 图表编辑主要属性汇总
<!DOCTYPE HTML>
<html>
<head>
<meta http-equiv="Content-Type" content="text/html; charset=utf-8">
<title>Highcharts Example</title>


<script type="text/javascript" src="http://cdn.hcharts.cn/jquery/jquery-1.8.2.min.js"></script>
<style type="text/css">
#container, #sliders {
min-width: 310px;
max-width: 800px;
margin: 0 auto;
}
#container {
height: 400px;
max-width: 800px;
}
</style>
<script type="text/javascript">


$(function () {


  Highcharts.setOptions({//全局变量设置,(本例用于汉化)
   lang:{
      contextButtonTitle:"图表导出菜单",
      decimalPoint:".",
      downloadJPEG:"下载JPEG图片",
      downloadPDF:"下载PDF文件",
      downloadPNG:"下载PNG文件",
      downloadSVG:"下载SVG文件",
      drillUpText:"返回 {series.name}",
      loading:"加载中",
      months:["一月","二月","三月","四月","五月","六月","七月","八月","九月","十月","十一月","十二月"],
      noData:"没有数据",
      numericSymbols: [ "千" , "兆" , "G" , "T" , "P" , "E"],
      printChart:"打印图表",
      resetZoom:"恢复缩放",
      resetZoomTitle:"恢复图表",
      shortMonths: [ "Jan" , "Feb" , "Mar" , "Apr" , "May" , "Jun" , "Jul" , "Aug" , "Sep" , "Oct" , "Nov" , "Dec"],
      thousandsSep:",",
      weekdays: ["星期一", "星期二", "星期三", "星期三", "星期四", "星期五", "星期六","星期天"]
   }
    });


    // Set up the chart
    var chart = new Highcharts.Chart({
        chart: {
        events: {
                click: function (event) {
                alert("点击了图表事件");
               }
            },
            renderTo: 'container',//容器,与id一致
            type: 'column',//图表显示类型,列
            margin: 100,//图与容器左右上下边距
            options3d: {
                enabled: true,//画图表是否启用3D函数
                alpha: 10,//内旋角度,垂直面向自己旋转向自己,
                //调外旋后,由于倾斜,导致图形左右间距不一样,
                //可以通过调plotOptions.column.pointPadding
                beta: 10,//外旋角度,左右顺时针
                depth: 100,//深度
                viewDistance: 100
            },
           style:{


           height:'500px'
               }

        },
         xAxis: {//x轴坐标
         lineWidth:1,//x轴线宽度
         gridLineWidth:2, //网格线宽度
         gridLineColor: '#197F07',//网格线颜色
        // tickPixelInterval:100,//设置x坐标之间的距离
         title: {
                text: 'x轴标题'                  //指定y轴的标题
            },
            categories: [1,2, 3,4] ,  //指定x轴分组
           plotBands: [{//标示区

            }]
        },
        yAxis: {//y轴坐标
        tickInterval: 20,//设置y轴间隔
            title: {
                text: 'y轴标题'                  //指定y轴的标题
            },
            labels: {
   formatter:function(){//格式化y轴坐标
     if(this.value <=50) {
       return "第一等级("+this.value+")";
     }else if(this.value >50 && this.value <=100) {
       return "第二等级("+this.value+")";
     }else {
       return "第三等级("+this.value+")";
     }
   }
 },
           plotLines:[{//标示线
             color:'red',            //线的颜色,定义为红色
             dashStyle:'longdashdot',//标示线的样式,默认是solid(实线),这里定义为长虚线
             value:100,                //定义在那个值上显示标示线,这里是在x轴上刻度为100的值处垂直化一条线
              width:2                 //标示线的宽度,2px
             }]
        },
        title: {//图表大标题
            text: '图表大标题',
            style : {
               color:'#FF2424'
              }
        },
        subtitle: {//图表小标题
            text: '图表小标题'
        },
        plotOptions: {//数据点配置,不同图形配置不一样
             column: {
              pointPadding:10,
                depth: 10,//图形在y轴上宽度(深度)
                //edgeWidth:10,//图形圆角半径
                pointWidth: 20//图形宽度
               // colorByPoint:true//同一组数据使用不同的颜色
            }
        },

        series: [{//数据


            name: 'John',//数据列名(图例)
            data: [[3,100],[0, 150], [2, -50], [1, 56.5]],//二维数组下标从0开始
            showInLegend: false // 设置为 false 即为不显示在图例中
        },
        {
            name: 'John1',
            color:'red',//本组数据的颜色
            data: [5, 7,
            { y : 100, color : "#BF0B23"}//设置单独数据点颜色
           ,4]//数据
        },
         {
            name: 'lhy',
             //colorByPoint:true,  或者直接写在这里
            data: [12, 3, 8,9],//数据
            //lineWidth: 5,//线条宽度
            //dashStyle: 'longdash'//线条样式


        }
        ],

        credits:{
// enabled:true,                    // 默认值,如果想去掉版权信息,设置为false即可
text:'版权信息-渐辉科技',               // 显示的文字
href:'http://www.qqqkj.cn',   // 链接地址
position:{                          // 位置设置
//align: 'left',
//x: 400,
//y: 500,
verticalAlign: 'bottom',

},
style: {                            // 样式设置
cursor: 'pointer',
color: 'red',
fontSize: '15px'
  }
}

    });


});


</script>
</head>
<body>
<script src="../js/highcharts.js"></script>
<script src="../js/highcharts-3d.js"></script>
<script src="../js/modules/exporting.js"></script>


<div id="container"></div>


</body>
</html>
