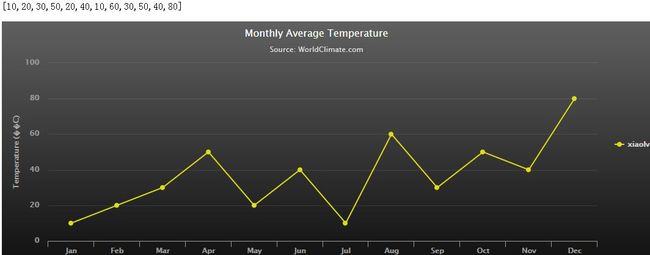
使用Highcharts生成折线图_at last
//数据库数据的读取,读取数据后数据格式的转换,还有highchart数据源的配置,伤透了脑筋。anyway,终于开张了,哈哈!
数据库连接:conn_orcale.php
<?php
$dbconn=oci_connect("dnc-local","dnc-local","orcl")or die("数据库连接错误");
?>
读取数据:
device_query.php
<?php
  require 'conn_orcale.php';
  $sql = "select * from xiaolv_month";
  $query = oci_parse($dbconn,$sql);
  oci_execute($query);
   <span style="color:#ff0000;">while( $a = oci_fetch_array($query))
   {

   	$b[] = intval($a[1]);

   }
    $data= json_encode($b);</span>
     oci_close($dbconn);
?>
或
<?php
  require 'conn_orcale.php';
  $sql = "select month,xiaolv from xiaolv_month";
  $query = oci_parse($dbconn,$sql);
  <span style="color:#ff0000;">$b=array();
   while( $a = oci_fetch_array($query))
   {
   	array_push($b,intval($a[1]));
   }
    echo json_encode($b);</span>
     oci_close($dbconn);
?>
使用Highcharts生成折线图:Test.php
<?php
  require 'device_query.php';
?>
<html>
<head>
<title>hello mnmlist!</title>
<meta http-equiv="Content-Type" content="text/html; charset=UTF-8">
<script type="text/javascript" src="js/jquery.min.js"></script>
<script type="text/javascript" src="js/highcharts.js"></script>
<script type="text/javascript" src="js/themes/gray.js"></script>
<script type="text/javascript" src="js/json_parse.js"></script>
<script type="text/javascript">
$(function () {
    $('#mnmlist').highcharts({
        title: {
            text: 'Monthly Average Temperature',
            x: -20 //center
        },
        subtitle: {
            text: 'Source: WorldClimate.com',
            x: -20
        },
        xAxis: {
            categories: ['Jan', 'Feb', 'Mar', 'Apr', 'May', 'Jun','Jul', 'Aug', 'Sep', 'Oct', 'Nov', 'Dec']
        },
        yAxis: {
            title: {
                text: 'Temperature (°C)'
            },
            plotLines: [{
                value: 0,
                width: 1,
                color: '#808080'
            }]
        },
        tooltip: {
            valueSuffix: '°C'
        },
        legend: {
            layout: 'vertical',
            align: 'right',
            verticalAlign: 'middle',
            borderWidth: 0
        },
        <span style="color:#ff0000;">series: [{
            name: 'xiaolv',
            data: <?php echo $data;?>
        }]</span>
    });
});
</script>
</head>
<body>
<p><?php echo $data."\n";?></p>
<div id="mnmlist" style="min-width:800px;height:400px"></div>
</body>
</html>
正能量,有图有真相。![]()
