【D3.js数据可视化系列教程】--(十一)散点图
【D3.js系列教程】--(十一)散点图
1、一般的散点绘制
用二维数组表示每个点的坐标
//Width and height
var w = 500;
var h = 100;
var dataset = [
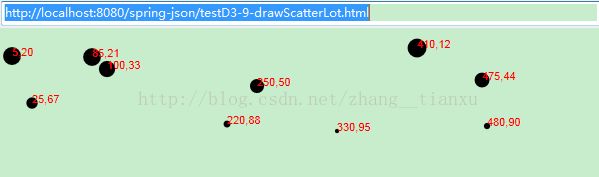
[5, 20], [480, 90], [250, 50], [100, 33], [330, 95],
[410, 12], [475, 44], [25, 67], [85, 21], [220, 88]
];
//Create SVG element
var svg = d3.select("body")
.append("svg")
.attr("width", w)
.attr("height", h);
svg.selectAll("circle")
.data(dataset)
.enter()
.append("circle")
.attr("cx", function(d) {
return d[0];
})
.attr("cy", function(d) {
return d[1];
})
.attr("r", 5);
2、点的大小
控制半径
.attr("r", function(d) {
return Math.sqrt(h - d[1]);
});
3、点的文本
注意文本的位置与圆中心的位置
svg.selectAll("text")
	.data(dataset)
	.enter()
	.append("text")
	.text(function(d) {
		return d[0] + "," + d[1];
	})
	.attr("x", function(d) {
		return d[0];
	})
	.attr("y", function(d) {
		return d[1];
	})
	.attr("font-family", "sans-serif")
	.attr("font-size", "11px")
	.attr("fill", "red");
4、源码
<!DOCTYPE html>
<html>
  <head>
		<meta charset="utf-8">
		<title>testD3-9-drawScatterLot.html</title>
		<script type="text/javascript" src="http://localhost:8080/spring/js/d3.v3.js"></script>
	<style type="text/css">
		</style>
	</head>
	<body>
		<script type="text/javascript">
//Width and height
			var w = 500;
			var h = 100;

			var dataset = [
							[5, 20], [480, 90], [250, 50], [100, 33], [330, 95],
							[410, 12], [475, 44], [25, 67], [85, 21], [220, 88]
						  ];

			//Create SVG element
			var svg = d3.select("body")
						.append("svg")
						.attr("width", w)
						.attr("height", h);

			svg.selectAll("circle")
			   .data(dataset)
			   .enter()
			   .append("circle")
			   .attr("cx", function(d) {
			   		return d[0];
			   })
			   .attr("cy", function(d) {
			   		return d[1];
			   })
			   .attr("r", function(d) {
			   		return Math.sqrt(h - d[1]);
			   });

			svg.selectAll("text")
			   .data(dataset)
			   .enter()
			   .append("text")
			   .text(function(d) {
			   		return d[0] + "," + d[1];
			   })
			   .attr("x", function(d) {
			   		return d[0];
			   })
			   .attr("y", function(d) {
			   		return d[1];
			   })
			   .attr("font-family", "sans-serif")
			   .attr("font-size", "11px")
			   .attr("fill", "red");
		</script>

	</body>
</html>
5、效果