R绘图
mac 上安装R: http://cran.r-project.org/bin/macosx/
R绘图常用的两个包
ggplot2:http://ggplot2.org/
lattice:http://cran.r-project.org/web/packages/lattice/index.html
推荐使用文艺版--ggplot2
安装
> install.packages("ggplot2")
练习使用,可参考30分钟学会ggplot2
查看包ggplot2中的数据集
> data(package='ggplot2')
查看其中diamonds数据集的信息
> str(diamonds)或
> summary(diamonds)
> attributes(diamonds)以及
> class(diamonds)
[1] "data.frame"
> mode(diamonds)
[1] "list"
> library(ggplot2)
> p<-ggplot(mpg,aes(x=cty,y=hwy))
遇到问题:
中文乱码:(![]() )
)

console
通过theme()来控制字体
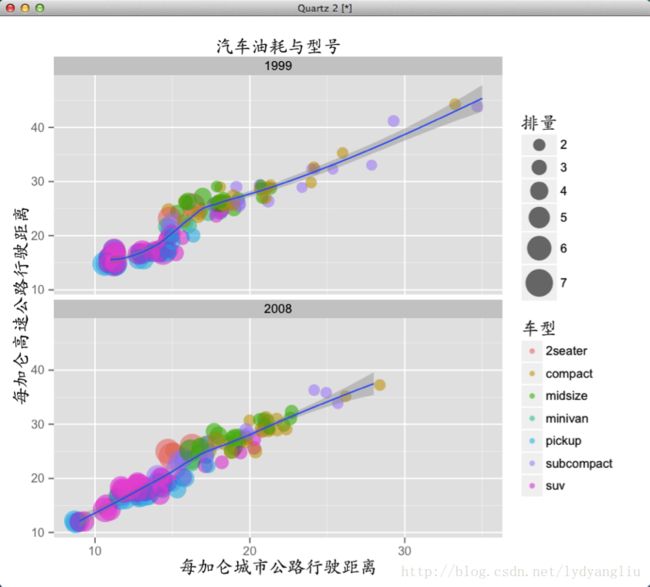
p+geom_point(aes(colour=class,size=displ),alpha=0.5,position="jitter")+stat_smooth()+scale_size_continuous(range=c(4,10))+facet_wrap(~year,ncol=1)+opts(title='汽车油耗与型号')+labs(y='每加仑高速公路行驶距离',x='每加仑城市公路行驶距离')+guides(size=guide_legend(title='排量'),colour=guide_legend(title='车型'),override.aes=list(size=5))+theme(plot.title=element_text(family="STKaiti",size=14),axis.title=element_text(family="STKaiti",size=14),legend.title=element_text(family="STKaiti",size=14))
dev
以输出到pdf为例:
> pdf(family="GB1",file='a.pdf')
>p+geom_point(aes(colour=class,size=displ),alpha=0.5,position="jitter")+stat_smooth()+scale_size_continuous(range=c(4,10))+facet_wrap(~year,ncol=1)+opts(title='汽车油耗与型号')+labs(y='每加仑高速公路行驶距离',x='每加仑城市公路行驶距离')+guides(size=guide_legend(title='排量'),colour=guide_legend(title='车型'),override.aes=list(size=5))
> dev.off()
效果

附上一份google的R规范
https://google-styleguide.googlecode.com/svn/trunk/Rguide.xml