FusionChartsFree在JSP中的用法
1.下载FusionChartsFree
2.将FusionChartsFree/Charts/*.swf 文件copy到WEB文件加下
3.新建JSP页面,引入如下片段
<jsp:include page="../../FusionChartsHTMLRenderer.jsp" flush="true">
<jsp:param name="chartSWF"
value="static/FusionCharts/Column3D.swf" />
<jsp:param name="strURL" value="" />
<jsp:param name="strXML" value="${strXML }" />
<jsp:param name="chartId" value="myNext" />
<jsp:param name="chartWidth" value="500" />
<jsp:param name="chartHeight" value="300" />
<jsp:param name="debugMode" value="false" />
</jsp:include>
FusionChartsHTMLRenderer.jsp 在FusionChartsFree/Code/Jsp/Includes/文件夹下,添加到web目录下,
3.在Controller中组织str
XML,如下:
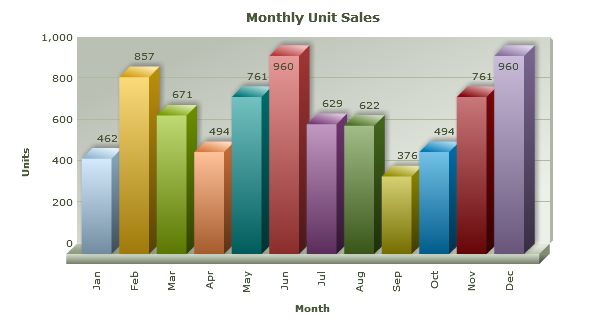
String strXML=<graph caption='Monthly Unit Sales' xAxisName='Month' yAxisName='Units' decimalPrecision='0' formatNumberScale='0'>
<set name='Jan' value='462' color='AFD8F8' />
<set name='Feb' value='857' color='F6BD0F' />
<set name='Mar' value='671' color='8BBA00' />
<set name='Apr' value='494' color='FF8E46' />
<set name='May' value='761' color='008E8E' />
<set name='Jun' value='960' color='D64646' />
<set name='Jul' value='629' color='8E468E' />
<set name='Aug' value='622' color='588526' />
<set name='Sep' value='376' color='B3AA00' />
<set name='Oct' value='494' color='008ED6' />
<set name='Nov' value='761' color='9D080D' />
<set name='Dec' value='960' color='A186BE' />
</graph>
4.启动web访问地址host:8080/webName/test/charts,可以看到如下3D柱状图

2.将FusionChartsFree/Charts/*.swf 文件copy到WEB文件加下
3.新建JSP页面,引入如下片段
<jsp:include page="../../FusionChartsHTMLRenderer.jsp" flush="true">
<jsp:param name="chartSWF"
value="static/FusionCharts/Column3D.swf" />
<jsp:param name="strURL" value="" />
<jsp:param name="strXML" value="${strXML }" />
<jsp:param name="chartId" value="myNext" />
<jsp:param name="chartWidth" value="500" />
<jsp:param name="chartHeight" value="300" />
<jsp:param name="debugMode" value="false" />
</jsp:include>
<%@ page language="java" import="java.util.*" pageEncoding="ISO-8859-1"%>
<%
String path = request.getContextPath();
String basePath = request.getScheme()+"://"+request.getServerName()+":"+request.getServerPort()+path+"/";
%>
<!DOCTYPE HTML PUBLIC "-//W3C//DTD HTML 4.01 Transitional//EN">
<html>
  <head>
    <base href="<%=basePath%>">
    <title>fusioncharts</title>
	<meta http-equiv="pragma" content="no-cache">
	<meta http-equiv="cache-control" content="no-cache">
	<meta http-equiv="expires" content="0">
	<meta http-equiv="keywords" content="keyword1,keyword2,keyword3">
	<meta http-equiv="description" content="This is my page">
	<!--
	<link rel="stylesheet" type="text/css" href="styles.css">
	-->
  </head>
  <body>
    <jsp:include
			page="../FusionChartsHTMLRenderer.jsp" flush="true">
		<jsp:param name="chartSWF"
			value="static/FusionCharts/Column3D.swf" />
		<jsp:param name="strURL" value="" />
		<jsp:param name="strXML" value="${strXML}" />
		<jsp:param name="chartId" value="myNext" />
		<jsp:param name="chartWidth" value="500" />
		<jsp:param name="chartHeight" value="300" />
		<jsp:param name="debugMode" value="false" />
	</jsp:include>
  </body>
</html>
FusionChartsHTMLRenderer.jsp 在FusionChartsFree/Code/Jsp/Includes/文件夹下,添加到web目录下,
3.在Controller中组织str
XML,如下:
String strXML=<graph caption='Monthly Unit Sales' xAxisName='Month' yAxisName='Units' decimalPrecision='0' formatNumberScale='0'>
<set name='Jan' value='462' color='AFD8F8' />
<set name='Feb' value='857' color='F6BD0F' />
<set name='Mar' value='671' color='8BBA00' />
<set name='Apr' value='494' color='FF8E46' />
<set name='May' value='761' color='008E8E' />
<set name='Jun' value='960' color='D64646' />
<set name='Jul' value='629' color='8E468E' />
<set name='Aug' value='622' color='588526' />
<set name='Sep' value='376' color='B3AA00' />
<set name='Oct' value='494' color='008ED6' />
<set name='Nov' value='761' color='9D080D' />
<set name='Dec' value='960' color='A186BE' />
</graph>
@Controller
@RequestMapping(value = "/test")
public class testController extends BaseController {
	Log log = LogFactory.getLog(testController.class);
	@RequestMapping(value = "/charts")
	@SystemNormalLog(description = "测试fusioncharts")
	public String testFusionCharts(HttpServletRequest request,HttpServletResponse response,Model model) {
		log.info("====Start");
		String strXML="<graph caption='Monthly Unit Sales' xAxisName='Month'" +
				" yAxisName='Units' decimalPrecision='0' formatNumberScale='0'>"+
	    "<set name='Jan' value='462' color='AFD8F8' />"+
	    "<set name='Feb' value='857' color='F6BD0F' />"+
	    "<set name='Mar' value='671' color='8BBA00' />"+
	    "<set name='Apr' value='494' color='FF8E46' />"+
	    "<set name='May' value='761' color='008E8E' />"+
	    "<set name='Jun' value='960' color='D64646' />"+
	    "<set name='Jul' value='629' color='8E468E' />"+
	    "<set name='Aug' value='622' color='588526' />"+
	    "<set name='Sep' value='376' color='B3AA00' />"+
	    "<set name='Oct' value='494' color='008ED6' />"+
	    "<set name='Nov' value='761' color='9D080D' />"+
	    "<set name='Dec' value='960' color='A186BE' />"+
	"</graph>";
		model.addAttribute("strXML", strXML);
		return "test/charts";
	}
}
4.启动web访问地址host:8080/webName/test/charts,可以看到如下3D柱状图
