ArcGIS教程:创建包含插图的地图册(一)
可将地图脚本与数据驱动页面集成,以使用单个地图文档创建在不同的页面上包括自定义插图的地图册。可以引入自定义逻辑,不仅控制插图的可见性,而且控制插图的大小、位置和范围。
创建地图册
第一步是创建地图文档和设置数据驱动页面。您将要设计所有页面共享的基线布局。
将插图添加到布局
有了基本页面布局之后,还需要插入用作插图的数据框。
步骤:
- 单击插入菜单并选择数据框。
- 为数据框指定唯一名称。此名称将用于在导出脚本中标识该数据框。
- 单击确定关闭数据框属性 对话框。
- 继续创建插图,根据需要添加并符号化所需图层。
为单个页面设置自定义插图
因为要在导出过程中为单个页面设置插图的范围、大小和位置,所以您需要提前知道这些值,以便在导出脚本中使用它们。这意味着,您首先需要决定哪些页面应该含有插图。接着需要导航到每个有插图的页面,按照您想要的在最终产品中的显示效果来设置布局,然后记录将在最终脚本中使用的相应设置。
以下步骤引导您完成手动记录地图系列中的一个页面需要的插图信息的过程。需要为包含插图的每个页面重复执行这些步骤。
步骤:
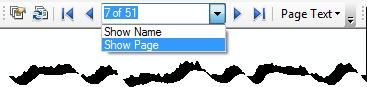
- 导航到将包含插图的页面。记录该页面的索引值,方法是打开数据驱动页面 工具条并将显示更改为显示页面。
- 确定插图数据框在页面上的位置和大小,然后设置范围。
- 记录插图的当前范围的“上”、“左”、“右”和“下”值。要获得这些信息,可打开插图的数据框属性 对话框,单击数据框选项卡,然后更改固定范围的范围以便出现相应坐标值。
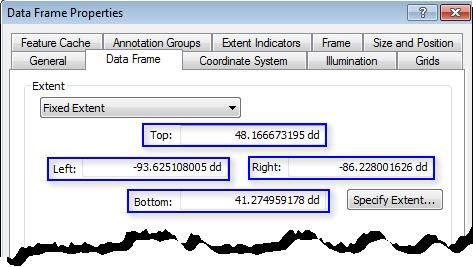
- 记录您所需要的信息,然后将范围更改回自动。如果范围未设置为自动,则不能在脚本中更改范围。其他范围类型是固定的,运行时会发成错误。
- 单击大小和位置选项卡,并记录 x 位置值和 y 位置值。请切记,这些值反映当前锚点,如果曾经更改锚点,则需要更新这些值。
- 也记录数据框的宽度值和高度值。
- 关闭数据框属性 对话框,小心不要应用任何不必要的更改。
注:您可以手动记录所有信息,也可以在 ArcMap Python 窗口中运行以下脚本以将信息写入文本文件。您可能需要调整变量名称,但以此方式写入信息:应只能将其复制和粘贴到脚本中。下面的代码块可在 ArcMap Python 窗口中运行,它将有关当前页面布局的信息写入指定的文本文件。
import os
# Create an output location variable
outputDirectory = r"C:\temp"
# Open a text file to append info to
insetTxt = outputDirectory + r"\insetInfo.txt"
FILE = open(insetTxt, "a")
try:
mxd = arcpy.mapping.MapDocument("current")
df = arcpy.mapping.ListDataFrames(mxd, "Inset*")[0]
ddp = mxd.dataDrivenPages
infoList = []
infoList.append("\n")
# The following is information you would like to record
# The text is written so it can be pasted directly into your script
# This example assumes that 'pgIndex' is the variable for the current page id
# and that 'dataFrame' is the variable for the data frame containing the inset map
infoList.append("if (pgIndex == " + str(ddp.currentPageID) + "):\n")
infoList.append("\tdataFrame.elementPositionX = " + str(df.elementPositionX) + "\n")
infoList.append("\tdataFrame.elementPositionY = " + str(df.elementPositionY) + "\n")
infoList.append("\tdataFrame.elementHeight = " + str(df.elementHeight) + "\n")
infoList.append("\tdataFrame.elementWidth = " + str(df.elementWidth) + "\n")
infoList.append("\tinsetExtent_" + str(ddp.currentPageID) + " = arcpy.Extent(" +
str(df.extent.XMin) + ", " + str(df.extent.YMin) + ", " +
str(df.extent.XMax) + ", " + str(df.extent.YMax) + ")" + "\n")
infoList.append("\tdataFrame.extent = insetExtent_" + str(ddp.currentPageID) + "\n")
FILE.writelines(infoList)
except:
print "Writing to file failed"
# Close the text file
FILE.close()
添加范围指示器
可将范围指示器添加到主地图,以高亮显示插图中显示的范围。
步骤:
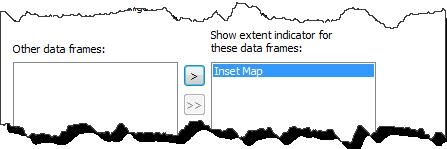
- 打开主地图的数据框属性 对话框,然后单击范围指示器选项卡。
- 添加“插图”数据框。
- 使用可用选项设置外观。