Python有趣|高德POI,玩转长沙
长沙CITY,长沙SHOW
长沙C-BLOCK,长沙FLOW
长沙妹驼,叫长沙GIRL
前言
说到长沙,大家第一想到的可能就是小吃,当然来长沙旅游,不光只是为了吃,这吃喝玩乐,咱都得来一套是吧。基于此,我调用了高德的API,来获取POI数据,带你玩转长沙。
首先,我们来看看POI的概念:POI(Point of Interest)简单的说就是兴趣点,在地理信息系统中,一个POI可以是一栋房子、一个商铺、一个邮筒、一个公交站等。
本教程包含内容:
- POI获取
- POI分析
POI获取
这里获取POI,用的是高德地图的API,和普通的API一样,大家注册后申请一个KEY,通过带有KEY的url来获取数据,这里只是带大家吃喝玩乐,所以只获取餐饮服务,购物服务和风景名胜POI,部分代码如下:
import requests
import json
import time
import csv

f = open('1.csv','a+',encoding='utf-8',newline='')
writer = csv.writer(f)
writer.writerow(['name','typ1','typ2','typ3','lon','lat'])

urls = ['https://restapi.amap.com/v3/place/text?types=110000&city=长沙&offset=20&page={}&key=这里填自己的key&extensions=all'.format(str(i)) for i in range(1,1000)]

for url in urls:
    res = requests.get(url)
    json_data = json.loads(res.text)
    count = json_data['count']
    # print(count,json_data)
    if int(count) == 0:
        break
    pois = json_data['pois']
    for poi in pois:
        name = poi['name']
        typ = poi['type']
        typ1 = typ.split(';')[0]
        typ2 = typ.split(';')[1]
        typ3 = typ.split(';')[2]
        location = poi['location']
        lon = location.split(',')[0]
        lat = location.split(',')[1]
        print(name,typ1,typ2,typ3,lon,lat)
        # writer.writerow([name,typ1,typ2,typ3,lon,lat])
    time.sleep(2)
POI分析
简单分析
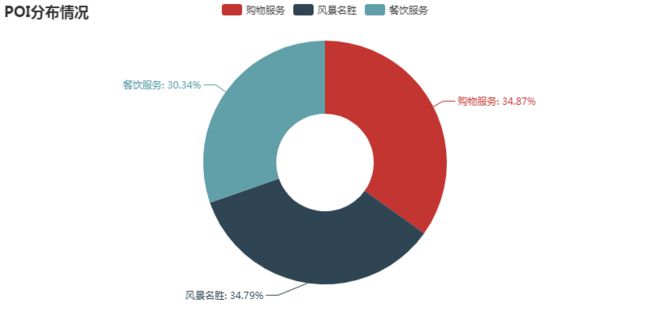
首先,针对大类(也就是餐饮服务,购物服务和风景名胜),看看长沙的分布情况。通过图可以看出,吃喝玩乐POI数量都差不多,所以来长沙玩,一座城市满足你所有需求。
from pyecharts import Pie

attr = list(ty1_class.index)
v1 = list(ty1_class)
pie = Pie('POI分布情况')
pie.add("", attr, v1, is_label_show=True, radius=[30, 75])
pie
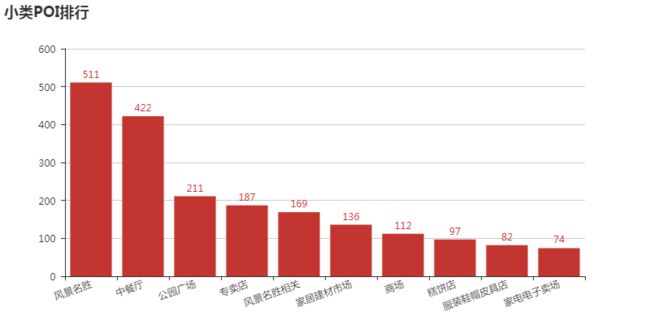
接着看小类,绘制前10的数据。可以看出,长沙小吃很有名,但风景名胜还是很多的(长沙市现在包括长沙县,浏阳和宁乡,这部分风景名胜较多)。
from pyecharts import Bar

bar = Bar('小类POI排行')
attr = list(ty2_class[:10].index)
v2 = list(ty2_class[:10])
bar.add("", attr, v2,xaxis_interval=0,xaxis_rotate=20,xaxis_margin=8,is_label_show=True)
bar
餐饮服务分析
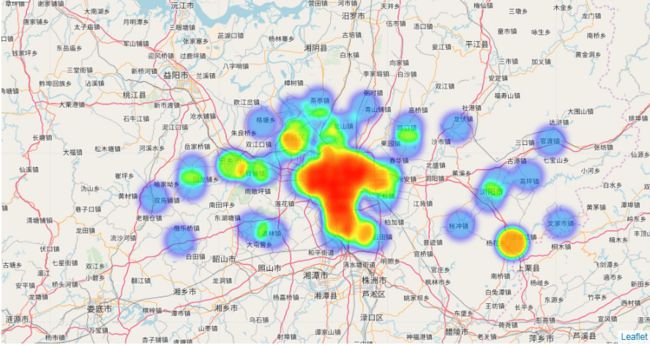
通过绘制地图热力图,看看小吃等饮食在长沙的分布情况,这次使用的是folium库(读者自行下载)。
- 整体上,小吃分布在中心市区
- 具体分布在五一广场,人民路附近。
什么臭豆腐、糖油粑粑、小龙虾,长沙米粉、猪油拌粉、混沌,小笼包、凉面、甜酒冲蛋……都可以在这吃到。
import folium
from folium import plugins
heatmap1 = folium.Map(location=[28.12, 112.59], zoom_start=11)
heatmap1.add_children(plugins.HeatMap([[row["lat"],row["lon"]] for name, row in df1.iterrows()]))
heatmap1.save("heatmap1.html")
heatmap1
ps:购物就不分析了。
风景名胜
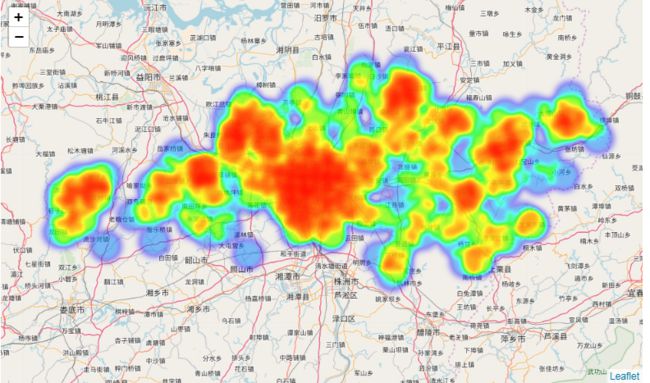
- 整体分布很均匀。
- 长沙又叫山水州城,这个山就是岳麓山(左边红框);水和州就是湘江和橘子洲(对应中间带状红框);右上角是烈士公园,烧烤好去处。
heatmap2 = folium.Map(location=[28.12, 112.59], zoom_start=11)
heatmap2.add_children(plugins.HeatMap([[row["lat"],row["lon"]] for name, row in df2.iterrows()]))
heatmap2.save("heatmap2.html")
heatmap2
今日互动
代码下载:https://github.com/panluoluo/crawler-analysis,下载完整数据和代码。
留言打卡:说说你所在城市的风景和美食吧。公众号后台回复【入群】,加入学习交流群,2019年一起搞事情。


