python可视化-matplotlib学习
本文记录了我对python画图的学习,循序渐进的,刚开始只求画出来。后面对画图类有了一点研究,代码逻辑更加清晰。
散点图
参考了[知乎-Matplotlib 如何画散点图的图例],[官方文档]
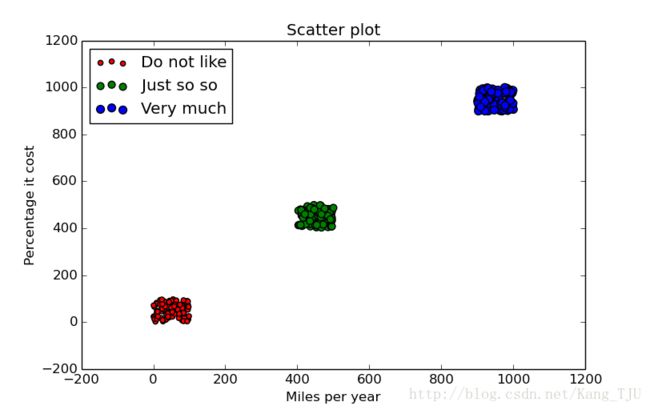
下面直接上代码:
#my_drawing.py
#-*- coding:utf-8
import traceback
import random
from matplotlib import pyplot as plt

def draw_scatter(X1, Y1, X2, Y2, X3, Y3):
    try:
        # 画框设置
        fig = plt.figure(figsize=(8, 5), dpi=80)  # 创建图像
        axes = fig.add_subplot(111)  # 创建一个1行1列的子图,axes是第1个图

        # 画点
        type1 = axes.scatter(X1, Y1, label = "Do not like", s=20, c='red')
        type2 = axes.scatter(X2, Y2, label = "Just so so",  s=40, c='green')
        type3 = axes.scatter(X3, Y3, label = "Very much",   s=50, c='blue')

        # 加标题
        plt.title("Scatter plot")
        # 加坐标轴
        plt.xlabel("Miles per year")
        plt.ylabel("Percentage it cost")
        # 加legend
        axes.legend(loc=2)

        # 显示
        plt.show()

    except Exception, e:
        print traceback.print_exc()

if __name__ == '__main__':

    table1_x = []
    table1_y = []
    # generate the dataset
    for i in range(0,100):
        x = random.randint(1,100)
        y = random.randint(1,100)
        table1_x.append(x)
        table1_y.append(y)


    table2_x = []
    table2_y = []
    # generate the dataset
    for i in range(0, 100):
        x = random.randint(401, 500)
        y = random.randint(401, 500)
        table2_x.append(x)
        table2_y.append(y)


    table3_x = []
    table3_y = []
    # generate the dataset
    for i in range(0, 100):
        x = random.randint(900, 1000)
        y = random.randint(900, 1000)
        table3_x.append(x)
        table3_y.append(y)


draw_scatter(table1_x, table1_y, table2_x, table2_y, table3_x, table3_y)折线图
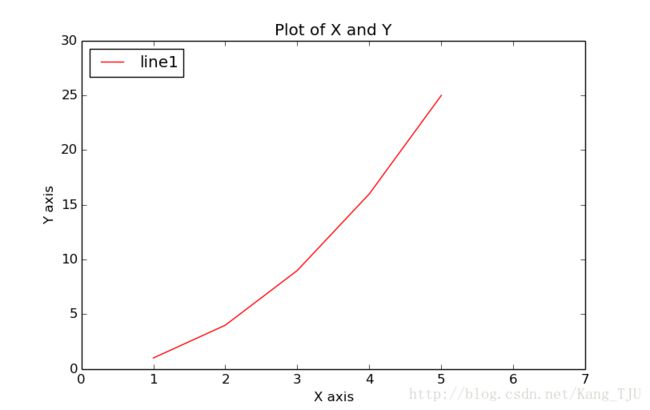
下面是折线图代码:
参考链接[matplotlib学习]
# my_drawing.py
# -*- coding:utf-8
import traceback
import random

def draw_line( X, Y ):
    try:
        # 画框设置
        fig = plt.figure(figsize=(8, 5), dpi=80) # 创建图像
        axes = fig.add_subplot(111) # 创建一个1行1列的子图,axes是第1个图

        # 画点
        type1 = axes.plot(X, Y, label = "line1", c = 'red')

        # 加标题
        plt.title("Plot of X and Y")
        # 加坐标轴
        plt.xlabel("X axis")
        plt.ylabel("Y axis")
        # 加坐标轴范围
        plt.xlim(0.0, 7.0)
        plt.ylim(0.0, 30.0)

        # 加legend
        axes.legend(loc = 2) # 设置legend位置

        # 显示
        plt.show()

    except Exception,e:
        print traceback.print_exc()

if __name__ == '__main__':
draw_line([1,2,3,4,5],[1,4,9,16,25])创建图和子图
这两天看了点matplotlib相关文档,稍微总结下。
Matplotlib 里的常用类的包含关系为 Figure -> Axes -> (Line2D, Text, etc.)一个Figure 对象可以包含多个子图(Axes),在 matplotlib 中用 Axes 对象表示一个绘图区域,可以理解为子图。
可以使用 subplot()快速绘制包含多个子图的图表,它的调用形式如下:
subplot(numRows, numCols, plotNum)
subplot 将整个绘图区域等分为 numRows 行* numCols 列个子区域,然后按照从左到右,从上到下的顺序对每个子区域进行编号,左上的子区域的编号为 1。
subplot 在 plotNum 指定的区域中创建一个轴对象。如果新创建的轴和之前创建的轴重叠的话,之前的轴将被删除。然后轴对象在相应区域进行画图。
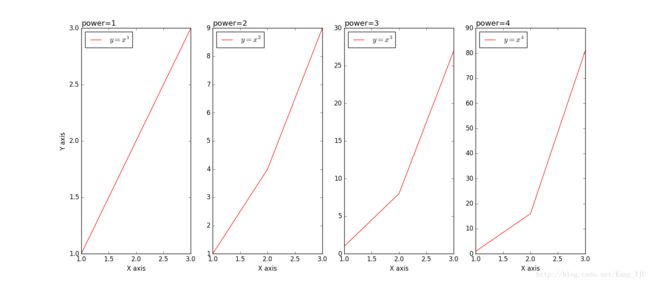
下面这段代码在一行当中花了四个折线图,分别是 y=x,y=x2,y=x3,y=x4
def draw_line( row_num, col_num, data_list ):
    try:

        # 创建图像
        fig = plt.figure(figsize=(20, 4), dpi=80)
        #label_list = [r"$y=x^{1}$",]
        for idx, data in enumerate(data_list):
            # 创建子图(轴对象)
            ax = fig.add_subplot(row_num, col_num, 1+idx) # 创建子图
            # 加点
            ax.plot(data[0],data[1], label="$y=x^{" + str(idx+1) +"}$" , color="red")

            # 加标题
            ax.set_title("power=" + str(idx+1), loc="left")
            # 加坐标轴
            ax.set_xlabel("X axis")
            if(not idx):
                ax.set_ylabel("Y axis")
            # 加legend
            ax.legend(loc = 2)

        # 显示图像
        plt.show()
    except Exception,e:
        print traceback.print_exc()

data_list = [
    [ [1,2,3], [1,2,3] ],
    [ [1,2,3], [1,4,9] ],
    [ [1,2,3], [1,8,27] ],
    [ [1,2,3], [1,16,81] ]
]
draw_line(1,4,data_list)有两个需要注意的地方:
- label在加点的时候就进行设置。这样legend()函数不需要再设置
- 支持latex数学公式的编辑。
- label = 这个标签不能省,负责会报错。
下面这段代码和上面实现一样的功能,只不过没有显示的指出对象。
plt.figure()返回figure对象。plt.subplot返回axes对象。
对于plt.subplot来说,它是在plt.figure()所返回的fig对象的基础至上,再进行axes对象的创建。
下面的plt.plot()也是在plt.subplot()所创建的ax对象基础之上进行画图。下面的代码只有一个figure,并且每次循环的时候也只涉及到一个ax,所以每次都用默认的figure和默认的ax进行画图。那就没必要保存,如果要存在多个figure和ax要进行切换的时候,前面一种办法就是可行的。需要每次保存画图的对象和子图对象。
#-*- coding:utf-8 -*-
import matplotlib.pyplot as plt
import numpy as np
from numpy.linalg import norm
import traceback
def draw_line1( row_num, col_num, data_list ):
    try:

        # 创建图像
        plt.figure(figsize=(20, 4), dpi=80)
        #label_list = [r"$y=x^{1}$",]
        for idx, data in enumerate(data_list):
            # 创建子图
            plt.subplot(row_num, col_num, 1+idx) # 创建子图
            # 加点
            plt.plot(data[0],data[1], label="$y=x^{" + str(idx+1) +"}$" , color="red")

            # 加标题
            plt.title("power=" + str(idx+1), loc="left")
            # 加坐标轴
            plt.xlabel("X axis")
            if(not idx):
                plt.ylabel("Y axis")
            # 加legend
            plt.legend(loc = 2)

        # 显示图像
        plt.show()
    except Exception,e:
        print traceback.print_exc()
子图切换
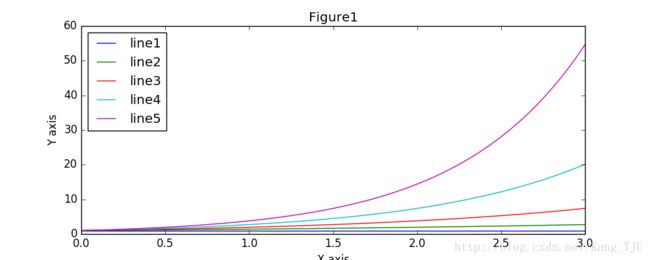
下面这段代码则比较好的说明了上面的内容,当出现多个图表。并且每个图表又有多个子图的时候。如果切换进行画图,那么必须保存子图对象。当利用该对象的时候,切换为该对象进行画图和设置。
#-*- coding:utf-8 -*-
import matplotlib.pyplot as plt
import numpy as np
from numpy.linalg import norm
import traceback
def draw_test():
    try:

        plt.figure(1,figsize=(10, 4))  # 创建图表 1
        plt.figure(2,figsize=(20, 4))  # 创建图表 2 并且此时默认的对象是当前图表 2

        ax1 = plt.subplot(1,2,1)  # 在图表 2 中创建子图 1
        ax2 = plt.subplot(1,2,2)  # 在图表 2 中创建子图 2

        x = np.linspace(0, 3, 100)

        for i in xrange(5):
            plt.figure(1)                   # 切换到图表1
            plt.plot(x, np.exp(i * x / 3), label="line"+str(i+1))  # 第一次会在图表1中创建子图1,并且是当前的默认子图

            plt.sca(ax1) # 切换到图表 2 的子图 1当中
            plt.plot(x, np.sin(i * x), label="line"+str(i+1))

            plt.sca(ax2) # 切换到图表 2 的子图 2当中
            plt.plot(x, np.cos(i * x), label="line"+str(i+1))

        # 切换到图表1的 子图1 进行设置, 图表1只有1个子图,可以默认获得。不用保存。
        plt.figure(1)
        plt.title("Figure1")
        plt.xlabel("X axis")
        plt.ylabel("Y axis")
        plt.legend(loc=2)

        # 切换到图表 2 的子图 1当中
        plt.sca(ax1)
        plt.title("Figure2 Ax1")
        plt.xlabel("X axis")
        plt.ylabel("Y axis")
        plt.legend(loc=3)

        # 切换到图表 2 的子图 2当中
        plt.sca(ax2)
        plt.title("Figure2 Ax2")
        plt.xlabel("X axis")
        plt.ylabel("Y axis")
        plt.legend(loc=3)

        # 显示所有图表
        plt.show()
    except Exception,e:
        print traceback.print_exc()


draw_test()柱状图
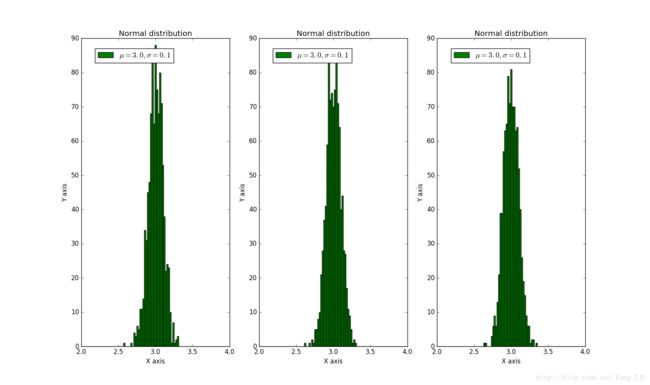
基本画图方法没区别,注意几个小点:
- bins=np.linspace(2, 4., 100), color=’green’)设置步长
- plt.legend(bbox_to_anchor=(0.65,0.98))设置legend位置,更加灵活,不用默认的loc
- [hist参数参考]
对于高斯分布数据的生成可以参照这个链接:[python numpy产生一个正太分布随机数的向量或者矩阵?]
下面是代码
import matplotlib.pyplot as plt
import numpy as np
from numpy.linalg import norm
import traceback

# 获取正态分布
def get_normal_distribution_sample(sample_num, mu, sigma):
    try:

        __mu = mu
        __sigma = sigma
        #np.random.seed(0)

        sample_list = np.random.normal(__mu, __sigma, sample_num)
        return sample_list

    except Exception,e:
        print traceback.print_exc()

# 获取三组正态分布数据
normal_data_list = []
data1 = get_normal_distribution_sample(1000, 3, 0.1)
data2 = get_normal_distribution_sample(1000, 3, 0.1)
data3 = get_normal_distribution_sample(1000, 3, 0.1)
normal_data_list.append(data1)
normal_data_list.append(data2)
normal_data_list.append(data3)

# 画图
def draw_hist(row_num, col_num, normal_data_list):
    try:

        plt.figure(figsize=(15,4), dpi = 80)
        for idx, data in enumerate(normal_data_list):
            plt.subplot(row_num, col_num, idx+1)

            plt.hist(data, label = "$\mu=3.0,\sigma=0.1$",bins=np.linspace(2, 4., 100), color='green')

            plt.title("Normal distribution")
            plt.xlabel("X axis")
            plt.ylabel("Y axis")

            plt.legend(bbox_to_anchor=(0.65,0.98))


        plt.show()
    except Exception,e:
        print traceback.print_exc()

draw_hist(1,3,normal_data_list)
颜色列表
| Colors-short | Colors |
|---|---|
| b | blue |
| g | green |
| r | red |
| c | cyan |
| m | magenta |
| y | yellow |
| k | black |
| w | white |
柱状图
#-*- coding:utf-8
import matplotlib.pyplot as plt
import numpy as np

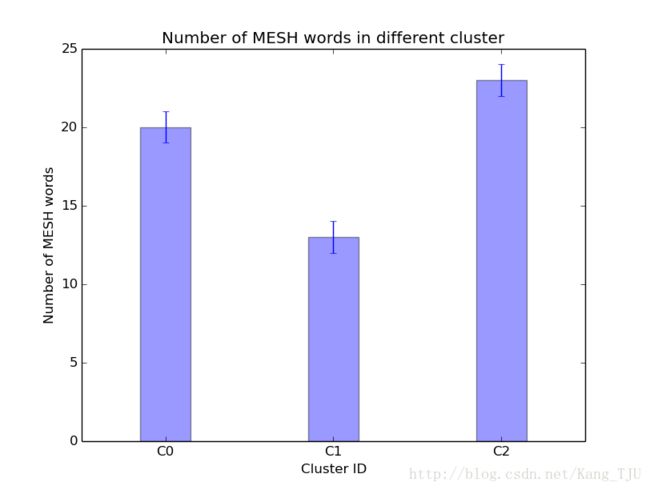
people = ('C0', 'C1', 'C2')
x_pos = np.arange(len(people))
performance = [20,13,23]
error = [1,1,1]

plt.bar(x_pos, performance, width=0.3, yerr=error, align='center', alpha=0.4)
plt.xticks(x_pos, people)
plt.xlabel("Cluster ID")
plt.ylabel('Number of MESH words')
plt.title("Number of MESH words in different cluster")
plt.show()