数据可视化---plotly篇
plotly
https://plot.ly/python/ plotly是现代平台的敏捷商业智能和数据科学库,它作为一款开源的绘图库,可以应用于Python、R、MATLAB、Excel、JavaScript和jupyter等多种语言,主要使用的js进行图形绘制,实现过程中主要就是调用plotly的函数接口,底层实现完全被隐藏,便于初学者的掌握。
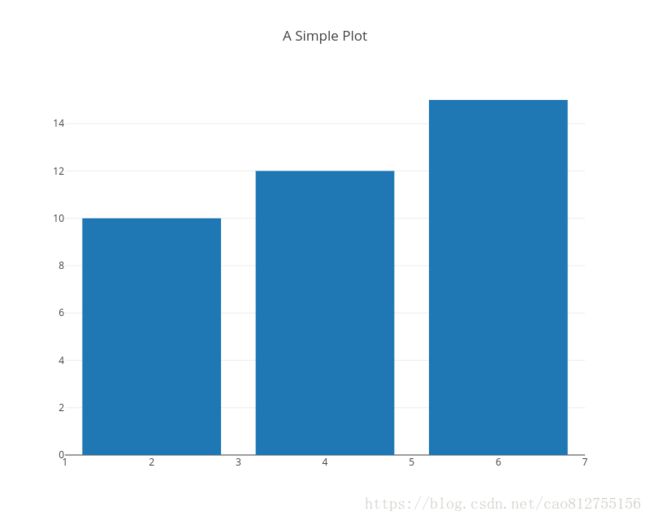
Basic Example
In [6]:
import
plotly.plotly
as
py
import
plotly.graph_objs
as
go
py
.
sign_in
(
'deamoncao'
,
'*******'
)
# 注意:这里是plotly网站的用户名和密码
trace
=
go
.
Bar
(
x
=
[
2
,
4
,
6
],
y
=
[
10
,
12
,
15
])
data
=
[
trace
]
layout
=
go
.
Layout
(
title
=
'A Simple Plot'
,
width
=
800
,
height
=
640
)
fig
=
go
.
Figure
(
data
=
data
,
layout
=
layout
)
py
.
image
.
save_as
(
fig
,
filename
=
'a-simple-plot.png'
)
from
IPython.display
import
Image
Image
(
'a-simple-plot.png'
)
Out[6]:
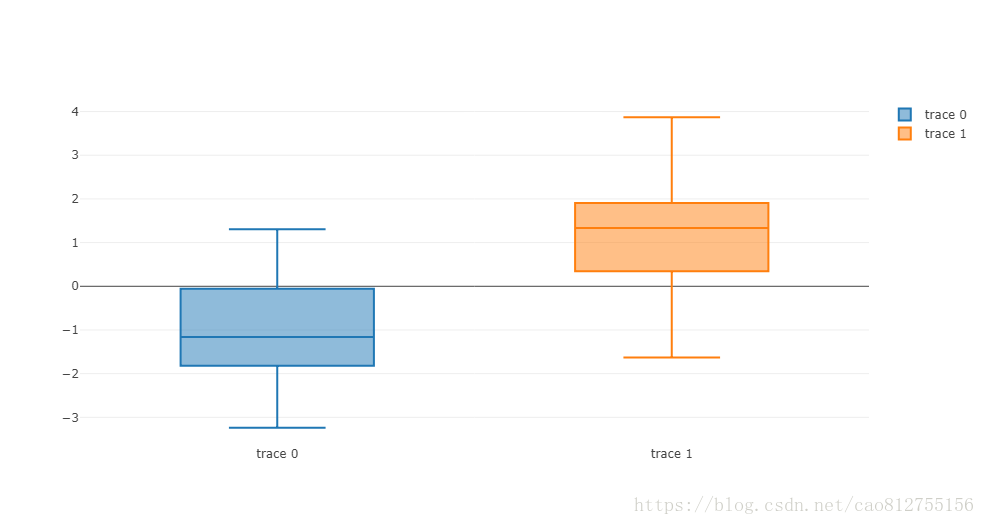
Basic Box Plot
https://plot.ly/python/box-plots/
In [22]:
import
plotly.plotly
as
py
import
plotly.graph_objs
as
go
import
numpy
as
np
y0
=
np
.
random
.
randn
(
50
)
-
1
y1
=
np
.
random
.
randn
(
50
)
+
1
trace0
=
go
.
Box
(
y
=
y0
)
trace1
=
go
.
Box
(
y
=
y1
)
data
=
[
trace0
,
trace1
]
py
.
iplot
(
data
)
Out[22]:
Fully Styled Box Plots
In [9]:
import
plotly.plotly
as
py
import
plotly.graph_objs
as
go
x_data
=
[
'Carmelo Anthony'
,
'Dwyane Wade'
,
'Deron Williams'
,
'Brook Lopez'
,
'Damian Lillard'
,
'David West'
,]
y0
=
np
.
random
.
randn
(
50
)
-
1
y1
=
np
.
random
.
randn
(
50
)
+
1
y2
=
np
.
random
.
randn
(
50
)
y3
=
np
.
random
.
randn
(
50
)
+
2
y4
=
np
.
random
.
randn
(
50
)
-
2
y5
=
np
.
random
.
randn
(
50
)
+
3
y_data
=
[
y0
,
y1
,
y2
,
y3
,
y4
,
y5
]
colors
=
[
'rgba(93, 164, 214, 0.5)'
,
'rgba(255, 144, 14, 0.5)'
,
'rgba(44, 160, 101, 0.5)'
,
'rgba(255, 65, 54, 0.5)'
,
'rgba(207, 114, 255, 0.5)'
,
'rgba(127, 96, 0, 0.5)'
]
traces
=
[]
for
xd
,
yd
,
cls
in
zip
(
x_data
,
y_data
,
colors
):
traces
.
append
(
go
.
Box
(
y
=
yd
,
name
=
xd
,
boxpoints
=
'all'
,
jitter
=
0.5
,
whiskerwidth
=
0.2
,
fillcolor
=
cls
,
marker
=
dict
(
size
=
2
,
),
line
=
dict
(
width
=
1
),
))
layout
=
go
.
Layout
(
title
=
'Points Scored by the Top 9 Scoring NBA Players in 2012'
,
yaxis
=
dict
(
autorange
=
True
,
showgrid
=
True
,
zeroline
=
True
,
dtick
=
5
,
gridcolor
=
'rgb(255, 255, 255)'
,
gridwidth
=
1
,
zerolinecolor
=
'rgb(255, 255, 255)'
,
zerolinewidth
=
2
,
),
margin
=
dict
(
l
=
40
,
r
=
30
,
b
=
80
,
t
=
100
,
),
paper_bgcolor
=
'rgb(243, 243, 243)'
,
plot_bgcolor
=
'rgb(243, 243, 243)'
,
showlegend
=
False
)
fig
=
go
.
Figure
(
data
=
traces
,
layout
=
layout
)
py
.
iplot
(
fig
)
Out[9]:
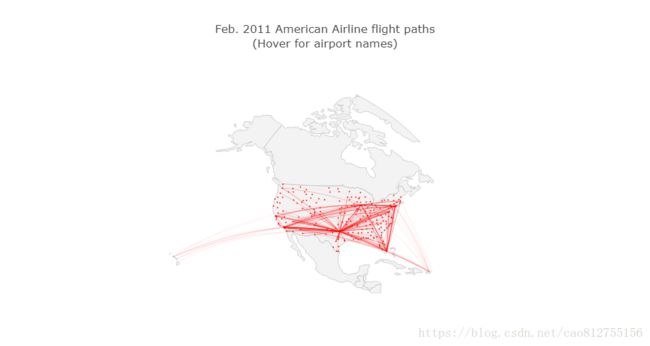
US Flight Paths Map
In [23]:
import
plotly.plotly
as
py
import
pandas
as
pd
df_airports
=
pd
.
read_csv
(
'https://raw.githubusercontent.com/plotly/datasets/master/2011_february_us_airport_traffic.csv'
)
df_airports
.
head
()
df_flight_paths
=
pd
.
read_csv
(
'https://raw.githubusercontent.com/plotly/datasets/master/2011_february_aa_flight_paths.csv'
)
df_flight_paths
.
head
()
airports
=
[
dict
(
type
=
'scattergeo'
,
locationmode
=
'USA-states'
,
lon
=
df_airports
[
'long'
],
lat
=
df_airports
[
'lat'
],
hoverinfo
=
'text'
,
text
=
df_airports
[
'airport'
],
mode
=
'markers'
,
marker
=
dict
(
size
=
2
,
color
=
'rgb(255, 0, 0)'
,
line
=
dict
(
width
=
3
,
color
=
'rgba(68, 68, 68, 0)'
)
))]
flight_paths
=
[]
for
i
in
range
(
len
(
df_flight_paths
)
):
flight_paths
.
append
(
dict
(
type
=
'scattergeo'
,
locationmode
=
'USA-states'
,
lon
=
[
df_flight_paths
[
'start_lon'
][
i
],
df_flight_paths
[
'end_lon'
][
i
]
],
lat
=
[
df_flight_paths
[
'start_lat'
][
i
],
df_flight_paths
[
'end_lat'
][
i
]
],
mode
=
'lines'
,
line
=
dict
(
width
=
1
,
color
=
'red'
,
),
opacity
=
float
(
df_flight_paths
[
'cnt'
][
i
])
/
float
(
df_flight_paths
[
'cnt'
]
.
max
()),
)
)
layout
=
dict
(
title
=
'Feb. 2011 American Airline flight paths
(Hover for airport names)' ,
(Hover for airport names)' ,
showlegend
=
False
,
geo
=
dict
(
scope
=
'north america'
,
projection
=
dict
(
type
=
'azimuthal equal area'
),
showland
=
True
,
landcolor
=
'rgb(243, 243, 243)'
,
countrycolor
=
'rgb(204, 204, 204)'
,
),
)
fig
=
dict
(
data
=
flight_paths
+
airports
,
layout
=
layout
)
py
.
iplot
(
fig
,
filename
=
'd3-flight-paths'
)
Out[23]:
Contour lines on globe
https://plot.ly/python/lines-on-maps/
In [24]:
import
plotly.plotly
as
py
import
pandas
as
pd
try
:
# Python 2
from
itertools
import
izip
except
ImportError
:
# Python 3
izip
=
zip
df
=
pd
.
read_csv
(
'https://raw.githubusercontent.com/plotly/datasets/master/globe_contours.csv'
)
df
.
head
()
contours
=
[]
scl
=
[
'rgb(213,62,79)'
,
'rgb(244,109,67)'
,
'rgb(253,174,97)'
,
\
'rgb(254,224,139)'
,
'rgb(255,255,191)'
,
'rgb(230,245,152)'
,
\
'rgb(171,221,164)'
,
'rgb(102,194,165)'
,
'rgb(50,136,189)'
]
def
pairwise
(
iterable
):
a
=
iter
(
iterable
)
return
izip
(
a
,
a
)
i
=
0
for
lat
,
lon
in
pairwise
(
df
.
columns
):
contours
.
append
(
dict
(
type
=
'scattergeo'
,
lon
=
df
[
lon
],
lat
=
df
[
lat
],
mode
=
'lines'
,
line
=
dict
(
width
=
2
,
color
=
scl
[
i
]
)
)
)
i
=
0
if
i
+
1
>=
len
(
df
.
columns
)
/
4
else
i
+
1
layout
=
dict
(
title
=
'Contour lines over globe
(Click and drag to rotate)' ,
(Click and drag to rotate)' ,
showlegend
=
False
,
geo
=
dict
(
showland
=
True
,
showlakes
=
True
,
showcountries
=
True
,
showocean
=
True
,
countrywidth
=
0.5
,
landcolor
=
'rgb(230, 145, 56)'
,
lakecolor
=
'rgb(0, 255, 255)'
,
oceancolor
=
'rgb(0, 255, 255)'
,
projection
=
dict
(
type
=
'orthographic'
,
rotation
=
dict
(
lon
=
-
100
,
lat
=
40
,
roll
=
0
)
),
lonaxis
=
dict
(
showgrid
=
True
,
gridcolor
=
'rgb(102, 102, 102)'
,
gridwidth
=
0.5
),
lataxis
=
dict
(
showgrid
=
True
,
gridcolor
=
'rgb(102, 102, 102)'
,
gridwidth
=
0.5
)
)
)
fig
=
dict
(
data
=
contours
,
layout
=
layout
)
py
.
iplot
(
fig
,
validate
=
False
,
filename
=
'd3-globe'
)
Out[24]:


