机器学习实战---------Logistic回归
看了半个礼拜的朴素贝叶斯,依然没有理解,想想还是跳过先看逻辑回归吧。
前面巴拉巴拉的话就不说了,下面直接贴代码。
5.2.2 训练算法
from math import *
from numpy import *
import os
os.chdir('D:\xx\machinelearning\MLiA_SourceCode')

def loadDataSet():
    dataMat = []; labelMat = []
    fr = open('testSet.txt')
    for line in fr.readlines():
        lineArr = line.strip().split()
        dataMat.append([1.0, float(lineArr[0]),float(lineArr[1])])
        labelMat.append(int(lineArr[2]))
    return dataMat,labelMat


def sigmoid(inX):
    return 1.0/(1 + exp(-inX))

def gradAscent(dataMatIn,classLabels):
    dataMatrix = mat(dataMatIn)
    labelMat = mat(classLabels).transpose()
    m,n = shape(dataMatrix)
    alpha = 0.001
    maxCycles = 500
    weights = ones((n,1))
    for k in range(maxCycles):
        h = sigmoid(dataMatrix * weights)
        error = (labelMat - h)
        weights = weights + alpha * dataMatrix.transpose() * error
return weights上面的代码没有什么大问题,就是在gradAscent函数中,作者给出了梯度计算
dataMatrix.transpose() * error接着,照葫芦画瓢,测试一下:
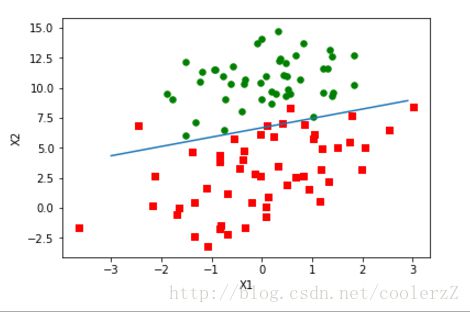
5.2.3 画出决策边界
代码直接贴上:
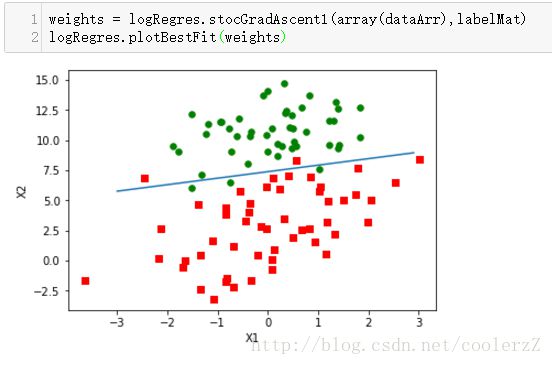
def plotBestFit(weights):
    import matplotlib.pyplot as plt
    dataMat,labelMat = loadDataSet()
    dataArr = array(dataMat)
    n = shape(dataArr)[0]
    xcord1 = []; ycord1 = []
    xcord2 = []; ycord2 = []
    for i in range(n):
        if int(labelMat[i]) == 1:
            xcord1.append(dataArr[i,1]); ycord1.append(dataArr[i,2])
        else:
            xcord2.append(dataArr[i,1]); ycord2.append(dataArr[i,2])
    fig = plt.figure()
    ax = fig.add_subplot(111)
    ax.scatter(xcord1,ycord1,s = 30,c = 'red',marker = 's')
    ax.scatter(xcord2,ycord2,s = 30, c = 'green')
    x = arange(-3.0,3.0,0.1)
    y = (-weights[0] - weights[1] * x)/weights[2]
    ax.plot(x,y)
    plt.xlabel('X1');plt.ylabel('X2')
plt.show()reload(logRegres)
weights = logRegres.gradAscent(dataArr,labelMat)#注意原书上有有坑,labelMat敲成了LabelMat
logRegres.plotBestFit(weights.getA())5.2.4 训练算法:随机梯度上升
代码是:
def stocGradAscent0(dataMatrix,classLabels):
    m,n = shape(dataMatrix)
    alpha = 0.01
    weights = ones(n)
    for i in range(m):
        h = sigmoid(sum(dataMatrix[i] * weights))
        error = classLabels[i] - h
        weights = weights + alpha * error * dataMatrix[i]
return weights接下来进行改进:
def stocGradAscent1(dataMatrix,classLabels,numIter = 150):
    m,n = shape(dataMatrix)
    weights = ones(n)
    for j in range(numIter):
        dataIndex = list(range(m))#python3中range不返回数组对象,而是返回range对象,所以注意与原书的区别
        for i in range(m):
            alpha = 4 / (1.0+j+i) + 0.01
            randIndex = int(random.uniform(0,len(dataIndex)))
            h = sigmoid(sum(dataMatrix[randIndex] * weights))
            error = classLabels[randIndex] - h
            weights = weights + alpha * error * dataMatrix[randIndex]
            del(dataIndex[randIndex])
    return weights
这个结果与gradAscent()差不多的效果,所用计算也得到减少。
5.3 从疝气病症预测病马的死亡率
5.3.1 处理数据中的缺失值
1.使用0来替换缺失值
2.类别标签缺失,将该条数据丢弃
5.3.2测试算法,使用Logistic回归进行分类
这块代码比较简单,直接贴上代码:
def classifyVector(inX,weights):
    prob = sigmoid(sum(inX * weights))
    if prob > 0.5:
        return 1.0
    else:
        return 0.0
def colicTest():
    frTrain = open('horseColicTraining.txt')
    frTest = open('horseColictest.txt')
    trainingSet = []; trainingLabels = []
    for line in frTrain.readlines():
        currLine = line.strip().split('\t')
        lineArr = []
        for i in range(21):
            lineArr.append(float(currLine[i]))
        trainingSet.append(lineArr)
        trainingLabels.append(float(currLine[21]))
    trainWeights = stocGradAscent1(array(trainingSet),trainingLabels,500)
    errorCount = 0;numTestVec = 0.0
    for line in frTest.readlines():
        numTestVec += 1.0
        currLine = line.strip().split('\t')
        lineArr = []
        for i in range(21):
            lineArr.append(float(currLine[i]))
        if int(classifyVector(array(lineArr),trainWeights)) != int(currLine[21]):
            errorCount += 1
    errorRate = (float(errorCount)/numTestVec)
    print('the error rate of this test is: %f' %errorRate)
    return errorRate

def multiTest():
    numTests = 10;errorSum = 0.0
    for k in range(numTests):
        errorSum += colicTest()
    print('after %d iterations the average error rate is:'
          '%f' %(numTests,errorSum/float(numTests)))
logRegres.multiTest()
the error rate of this test is: 0.283582
the error rate of this test is: 0.388060
the error rate of this test is: 0.298507
the error rate of this test is: 0.388060
the error rate of this test is: 0.447761
the error rate of this test is: 0.313433
the error rate of this test is: 0.283582
the error rate of this test is: 0.402985
the error rate of this test is: 0.343284
the error rate of this test is: 0.417910
after 10 iterations the average error rate is:0.356716

