MPChart画图:折线图、饼状图、柱状图
日常入门代码,欢迎品评。有些地方没有讲清楚,因为我自己也没哟搞清楚,大家浅尝辄止。
折线图 LineChart
先看图:
代码部分:
    private void initLineChart(){
        Description description = new Description();
        description.setText("give a mark");
        description.setTextSize(16);
        lineChart.setDescription(description);
        String[] xData = {"1", "2", "3", "4", "5"};//预设的x轴的数据
        String[] yData = {"80", "85", "80","90", "95"};//预设的y轴的数据
        LineData lineData = getData(xData, yData);
        lineChart.setData(lineData);
        lineChart.setAutoScaleMinMaxEnabled(false);
        lineChart.setBorderWidth(1f);//设置边框的宽度(粗细)
        lineChart.setDrawBorders(true);//显示图形的边框(边界)
        lineChart.setDragXEnabled(true);//在放大的情况下,能否拖动x轴
        lineChart.setDragYEnabled(true);
        lineChart.setTouchEnabled(true);//设置为false的话,界面就像是一个图片
        lineChart.setBackgroundColor(Color.parseColor("#d1d1d1"));
        lineChart.setDrawMarkers(true);//设置是否显示
        lineChart.setMarker(new IMarker() {//设置imarker可以设置点击数据的时候出现的图形。
            @Override
            public MPPointF getOffset() {
                return null;
            }

            @Override
            public MPPointF getOffsetForDrawingAtPoint(float posX, float posY) {
                return null;
            }

            @Override
            public void refreshContent(Entry e, Highlight highlight) {

            }

            @Override
            public void draw(Canvas canvas, float posX, float posY) {
                Paint paint = new Paint(Paint.ANTI_ALIAS_FLAG);
                paint.setColor(Color.GREEN);
                paint.setTextSize(22f);
                canvas.drawText("here", posX, posY, paint);
            }
        });

        lineChart.animateX(500);
    }

    private LineData getData(String[] xd, String[] yd){
        //节点
        ArrayList nodeData = new ArrayList<>();
        for (int i = 0; i < xd.length; i ++){
            nodeData.add(new Entry(Float.parseFloat(xd[i]), Float.parseFloat(yd[i])));
        }
        LineDataSet lineDataSet = new LineDataSet(nodeData, "Score for fisrt five time");
        lineDataSet.setDrawFilled(true);//就是折线图下面是否有阴影填充,这样看起来就像是起伏的山脉
        lineDataSet.setFillColor(Color.GREEN);
        lineDataSet.setDrawCircles(true);//数据是否用圆圈显示
        lineDataSet.setCircleColor(Color.BLACK);//显示数据的圆的颜色
        lineDataSet.setCircleRadius(4f);//显示数据的圆的半径
        lineDataSet.setCircleColors(Color.BLACK, Color.GRAY, Color.BLUE, Color.GREEN, Color.RED);//显示的几个数据的园的颜色
        lineDataSet.setDrawCircleHole(true);//数据是否用环形圆圈(同心圆)显示
        lineDataSet.setCircleHoleColor(Color.YELLOW);//同心圆内圆的颜色,即圆孔的颜色
        lineDataSet.setCircleHoleRadius(2f);//内圆的半径
        lineDataSet.setColor(Color.GRAY);//折线的颜色,以及label前面图形的颜色
        lineDataSet.setValueTextSize(10f);//数据的字体大小
        lineDataSet.setHighlightEnabled(true);//设置是否显示十字架的凸显样式
        lineDataSet.setHighLightColor(Color.BLACK);//设置图形样式的颜色
        lineDataSet.setDrawHorizontalHighlightIndicator(false);//设置凸显样式水平图形显隐
        lineDataSet.setDrawVerticalHighlightIndicator(true);//设置凸显样式垂直图形显隐
        lineDataSet.setHighlightLineWidth(1f);//点击数据会出现十字架形状的定位显示,设置该十字架的宽度
        lineDataSet.setLineWidth(2f);//设置折线的宽度
        lineDataSet.setFormSize(10f);//label前面的图形的大小
        lineDataSet.setForm(Legend.LegendForm.CIRCLE);//设置图例的图形的形状
        lineDataSet.setMode(LineDataSet.Mode.CUBIC_BEZIER);//设置折线的形状:直线、梯形、贝塞尔曲线
        lineDataSet.setCubicIntensity(0.5f);//修改CUBIC_BEZIER模式下面的曲线的一个参数,会让曲线变的很奇怪
        return new LineData(lineDataSet);
    }
饼状图: PieChart
先看图:
代码部分:
    private void initPieChart(){
        pieChart.setUsePercentValues(false);//这货,是否使用百分比显示,但是我还是没操作出来。
        Description description = pieChart.getDescription();
        description.setText("Assets View"); //设置描述的文字
        pieChart.setHighlightPerTapEnabled(true); //设置piecahrt图表点击Item高亮是否可用
        pieChart.animateX(2000);
        initPieChartData();

        pieChart.setDrawEntryLabels(true); // 设置entry中的描述label是否画进饼状图中
        pieChart.setEntryLabelColor(Color.GRAY);//设置该文字是的颜色
        pieChart.setEntryLabelTextSize(10f);//设置该文字的字体大小

        pieChart.setDrawHoleEnabled(true);//设置圆孔的显隐,也就是内圆
        pieChart.setHoleRadius(28f);//设置内圆的半径。外圆的半径好像是不能设置的,改变控件的宽度和高度,半径会自适应。
        pieChart.setHoleColor(Color.WHITE);//设置内圆的颜色
        pieChart.setDrawCenterText(true);//设置是否显示文字
        pieChart.setCenterText("Test");//设置饼状图中心的文字
        pieChart.setCenterTextSize(10f);//设置文字的消息
        pieChart.setCenterTextColor(Color.RED);//设置文字的颜色
        pieChart.setTransparentCircleRadius(31f);//设置内圆和外圆的一个交叉园的半径,这样会凸显内外部的空间
        pieChart.setTransparentCircleColor(Color.BLACK);//设置透明圆的颜色
        pieChart.setTransparentCircleAlpha(50);//设置透明圆你的透明度


        Legend legend = pieChart.getLegend();//图例
        legend.setEnabled(true);//是否显示
        legend.setVerticalAlignment(Legend.LegendVerticalAlignment.TOP);//对齐
        legend.setHorizontalAlignment(Legend.LegendHorizontalAlignment.LEFT);//对齐
        legend.setForm(Legend.LegendForm.DEFAULT);//设置图例的图形样式,默认为圆形
        legend.setOrientation(Legend.LegendOrientation.VERTICAL);//设置图例的排列走向:vertacal相当于分行
        legend.setFormSize(6f);//设置图例的大小
        legend.setTextSize(8f);//设置图注的字体大小
        legend.setFormToTextSpace(4f);//设置图例到图注的距离

        legend.setDrawInside(true);//不是很清楚
        legend.setWordWrapEnabled(false);//设置图列换行(注意使用影响性能,仅适用legend位于图表下面),我也不知道怎么用的
        legend.setTextColor(Color.BLACK);


    }

    private void initPieChartData(){
        ArrayList pieEntries = new ArrayList<>();
        pieEntries.add(new PieEntry(70f, "cash banlance : 1500"));
        pieEntries.add(new PieEntry(30f, "consumption banlance : 500"));
        pieEntries.add(new PieEntry(30f, "else : 500"));

        PieDataSet pieDataSet = new PieDataSet(pieEntries, null);
        pieDataSet.setColors(Color.parseColor("#f17548"), Color.parseColor("#FF9933"), Color.YELLOW);
        pieDataSet.setSliceSpace(3f);//设置每块饼之间的空隙
        pieDataSet.setSelectionShift(10f);//点击某个饼时拉长的宽度

        PieData pieData = new PieData(pieDataSet);
        pieData.setDrawValues(true);
        pieData.setValueTextSize(12f);
        pieData.setValueTextColor(Color.BLUE);

        pieChart.setData(pieData);
        pieChart.invalidate();

    }
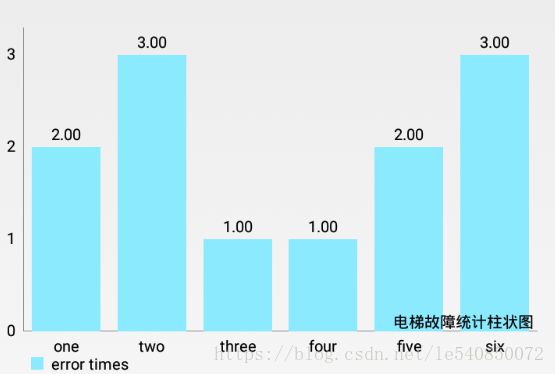
柱状图 BarChart
先看图
代码部分
    private void initBarChart(){
        Description description = barChart.getDescription();
        description.setText("电梯故障统计柱状图");
        description.setTextSize(10f);
        barChart.setNoDataText("no data.");
        // 集双指缩放
        barChart.setPinchZoom(false);
        barChart.animateY(2000);

        ArrayList barEntries = new ArrayList<>();
        barEntries.add(new BarEntry(1, 2));
        barEntries.add(new BarEntry(2, 3));
        barEntries.add(new BarEntry(3, 1));
        barEntries.add(new BarEntry(4, 1));
        barEntries.add(new BarEntry(5, 2f));
        barEntries.add(new BarEntry(6, 3));

        BarDataSet barDataSet = new BarDataSet(barEntries, "error times");

        BarData barData = new BarData(barDataSet);
        barData.setDrawValues(true);//是否显示柱子的数值
        barData.setValueTextSize(10f);//柱子上面标注的数值的字体大小
        barData.setBarWidth(0.8f);//每个柱子的宽度
        barChart.setData(barData);

        XAxis xAxis = barChart.getXAxis();
        xAxis.setDrawLabels(true);//是否显示x坐标的数据
        xAxis.setPosition(XAxis.XAxisPosition.BOTTOM);//设置x坐标数据的位置
        xAxis.setDrawGridLines(false);//是否显示网格线中与x轴垂直的网格线
//        xAxis.setLabelCount(6, true);//设置x轴显示的标签的个数
        final List xValue = new ArrayList<>();
        xValue.add("zero");//index = 0 的位置的数据在IndexAxisValueFormatter中时不显示的。
        xValue.add("one");
        xValue.add("two");
        xValue.add("three");
        xValue.add("four");
        xValue.add("five");
        xValue.add("six");
        xAxis.setValueFormatter(new IndexAxisValueFormatter(xValue));//设置x轴标签格式化器

        YAxis rightYAxis = barChart.getAxisRight();
        rightYAxis.setDrawGridLines(false);
        rightYAxis.setEnabled(true);//设置右侧的y轴是否显示。包括y轴的那一条线和上面的标签都不显示
        rightYAxis.setDrawLabels(false);//设置y轴右侧的标签是否显示。只是控制y轴处的标签。控制不了那根线。
        rightYAxis.setDrawAxisLine(false);//这个方法就是专门控制坐标轴线的

        YAxis leftYAxis = barChart.getAxisLeft();
        leftYAxis.setEnabled(true);
        leftYAxis.setDrawLabels(true);
        leftYAxis.setDrawAxisLine(true);
        leftYAxis.setPosition(YAxis.YAxisLabelPosition.OUTSIDE_CHART);
        leftYAxis.setDrawGridLines(false);//只有左右y轴标签都设置不显示水平网格线,图形才不会显示网格线
        leftYAxis.setDrawGridLinesBehindData(true);//设置网格线是在柱子的上层还是下一层(类似Photoshop的层级)
        leftYAxis.setGranularity(1f);//设置最小的间隔,防止出现重复的标签。这个得自己尝试一下就知道了。
        leftYAxis.setAxisMinimum(0);//设置左轴最小值的数值。如果IndexAxisValueFormatter自定义了字符串的话,那么就是从序号为2的字符串开始取值。
        leftYAxis.setSpaceBottom(0);//左轴的最小值默认占有10dp的高度,如果左轴最小值为0,一般会去除0的那部分高度
        //自定义左侧标签的字符串,可以是任何的字符串、中文、英文等
        leftYAxis.setValueFormatter(new IndexAxisValueFormatter(new String[]{ "0", "1", "2", "3", "4", "5"}));

    }
双柱图
看图:
代码部分:
 private void initBarChart(){
        Description description = barChart.getDescription();
        description.setText("电梯故障统计柱状图");
        description.setTextSize(10f);
        barChart.setNoDataText("no data.");
        // 集双指缩放
        barChart.setPinchZoom(false);
        barChart.animateY(2000);

        ArrayList barEntries1 = new ArrayList<>();
        barEntries1.add(new BarEntry(1, 2));
        barEntries1.add(new BarEntry(2, 3));
        barEntries1.add(new BarEntry(3, 1));
        barEntries1.add(new BarEntry(4, 1));
        barEntries1.add(new BarEntry(5, 2f));
        barEntries1.add(new BarEntry(6, 3));

        ArrayList barEntries2 = new ArrayList<>();
        barEntries2.add(new BarEntry(1, 1));
        barEntries2.add(new BarEntry(2, 1));
        barEntries2.add(new BarEntry(3, 1));
        barEntries2.add(new BarEntry(4, 1));
        barEntries2.add(new BarEntry(5, 2f));
        barEntries2.add(new BarEntry(6, 2));

        BarDataSet barDataSet1 = new BarDataSet(barEntries1, "error times");
        barDataSet1.setColor(Color.BLUE);
        BarDataSet barDataSet2 = new BarDataSet(barEntries2, "error times");
        barDataSet2.setColor(Color.BLACK);
        ArrayList iBarDataSets = new ArrayList<>();

        iBarDataSets.add(barDataSet1);
        iBarDataSets.add(barDataSet2);

        BarData barData = new BarData(iBarDataSets);
        barData.setValueFormatter(new IValueFormatter() {
            @Override
            public String getFormattedValue(float value, Entry entry, int dataSetIndex, ViewPortHandler viewPortHandler) {
                return (int) value + "";//通过重写格式化器中的方法,可以设置柱子上面的数据为整数。
            }
        });
        barData.setDrawValues(true);//是否显示柱子的数值
        barData.setValueTextSize(10f);//柱子上面标注的数值的字体大小
        barData.setBarWidth(0.3f);//每个柱子的宽度
        barChart.setData(barData);
        //如果不设置组直接的距离的话,那么两个柱子会公用一个空间,即发生重叠;另外,设置了各种距离之后,X轴方向会自动调整距离,以保持“两端对齐”
        barChart.groupBars(0.45f/*从X轴哪个位置开始显示,这个参数具体啥意思。。。*/, 0.32f/*组与组之间的距离*/, 0.05f/*组中每个柱子之间的距离*/);

        XAxis xAxis = barChart.getXAxis();
        xAxis.setDrawLabels(true);//是否显示x坐标的数据
        xAxis.setPosition(XAxis.XAxisPosition.BOTTOM);//设置x坐标数据的位置
        xAxis.setDrawGridLines(false);//是否显示网格线中与x轴垂直的网格线
//        xAxis.setLabelCount(6, true);//设置x轴显示的标签的个数
        final List xValue = new ArrayList<>();
        xValue.add("zero");//index = 0 的位置的数据是否显示,跟barChart.groupBars中的第一个参数有关。
        xValue.add("one");
        xValue.add("two");
        xValue.add("three");
        xValue.add("four");
        xValue.add("five");
        xValue.add("six");
        xAxis.setValueFormatter(new IndexAxisValueFormatter(xValue));//设置x轴标签格式化器

        YAxis rightYAxis = barChart.getAxisRight();
        rightYAxis.setDrawGridLines(false);
        rightYAxis.setEnabled(true);//设置右侧的y轴是否显示。包括y轴的那一条线和上面的标签都不显示
        rightYAxis.setDrawLabels(false);//设置y轴右侧的标签是否显示。只是控制y轴处的标签。控制不了那根线。
        rightYAxis.setDrawAxisLine(false);//这个方法就是专门控制坐标轴线的

        YAxis leftYAxis = barChart.getAxisLeft();
        leftYAxis.setEnabled(true);
        leftYAxis.setDrawLabels(true);
        leftYAxis.setDrawAxisLine(true);
        leftYAxis.setPosition(YAxis.YAxisLabelPosition.OUTSIDE_CHART);
        leftYAxis.setDrawGridLines(false);//只有左右y轴标签都设置不显示水平网格线,图形才不会显示网格线
        leftYAxis.setDrawGridLinesBehindData(true);//设置网格线是在柱子的上层还是下一层(类似Photoshop的层级)
        leftYAxis.setGranularity(1f);//设置最小的间隔,防止出现重复的标签。这个得自己尝试一下就知道了。
        leftYAxis.setAxisMinimum(0);//设置左轴最小值的数值。如果IndexAxisValueFormatter自定义了字符串的话,那么就是从序号为2的字符串开始取值。
        leftYAxis.setSpaceBottom(0);//左轴的最小值默认占有10dp的高度,如果左轴最小值为0,一般会去除0的那部分高度
        //自定义左侧标签的字符串,可以是任何的字符串、中文、英文等
        leftYAxis.setValueFormatter(new IndexAxisValueFormatter(new String[]{ "0", "1", "2", "3", "4", "5"}));

    }


