Numpy——统计运算
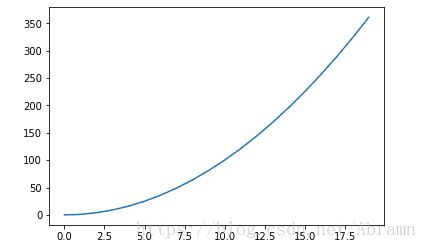
简单可视化
import matplotlib.pyplot as plt
import numpy as np
x=np.arange(20)
y=x**2
plt.plot(x,y)
plt.show()import numpy as np
arr = np.random.normal(1.75, 0.1, (4, 5))
print(arr)
after_arr=arr[0:3,2:4]
print(after_arr)
##
[[1.63974923 1.87725788 1.72976006 1.6519375 1.71506429] [1.65552989 1.954125 1.74111857 1.72836952 1.80377434] [1.59838071 1.804744 1.61198759 1.82304476 1.77045724] [1.833773 1.70754305 1.87113243 1.60131881 1.67524469]]
[[1.72976006 1.6519375 ] [1.74111857 1.72836952] [1.61198759 1.82304476]]条件判断
import numpy as np
score=np.array([[80,88],[82,81],[84,75],[86,83],[75,81]])
print(score>80)#条件判断
[False  True]
 [ True  True]
 [ True False]
 [ True  True]
 [False  True]]
import numpy as np
score1=np.array([[80,88],[82,81],[84,75],[86,83],[75,81]])
np.where(score1>80,0,90)#三目运算符
##
array([[90, 0], [ 0, 0], [ 0, 90], [ 0, 0], [90, 0]])指定轴平均值、最大值、最小值
import numpy as np
score1=np.array([[80,88,85],[82,81,75],[84,75,68],[86,83,86],[75,81,90]])
result=np.amax(score1,axis=0)#求每一列的最大值
result1=np.amax(score1,axis=1)#求每一行的最大值
meaning1=np.mean(score1,axis=0)#求出每一列的平均值
meaning2=np.mean(score1,axis=1)#求出每一行的平均值
print(result1)
print(result)
print(meaning1)
print(meaning2)
##
[88 82 84 86 90]
[86 88 90]
[81.4 81.6 80.8]
[84.33333333 79.33333333 75.66666667 85.         82.        ]
方差(std)
import numpy as np
finance_data=np.array([[5405,6825,6250],[5482,6581,6575],[6684,6675,7568],[6586,6283,6586],[6875,5181,6690]])
print(finance_data)
finance_data_std = np.std(finance_data, axis=0)#计算每列的方差
print(finance_data_std)
##
[[5405 6825 6250] [5482 6581 6575] [6684 6675 7568] [6586 6283 6586] [6875 5181 6690]]
[630.27314714 591.14397569 442.47775085]