基于springcloud的开发者实践:hystrix-dashboard熔断仪表盘
断路器仪表盘HystrixDashboard
Hystrix-dashboard是一款针对Hystrix进行实时监控的工具,通过Hystrix Dashboard可以直观地看到各Hystrix Command的请求响应时间,请求成功率等数据。
1、 新建工程hystrix-dashboard
pom.xml文件依赖如下
2、 开启HystrixDashBoard
在启动类中,添加@EnableHystrixDashboard注解,开启HystrixDashBoard

3、 yml配置文件

server:
port: 8766
spring:
application:
name: hystrix-dashboard
eureka:
client:
serviceUrl:
defaultZone: http://localhost:8761/eureka/
instance:
lease-expiration-duration-in-seconds: 2
lease-renewal-interval-in-seconds: 1
logging:
file: hystrix-dashboard.log
端口号为8766,并且注册到eureka中,服务名为hystrix-dashboard。
4、 访问仪表盘界面
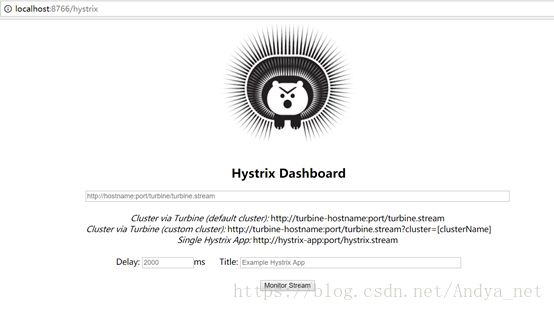
5、 对负载均衡ribbon进行熔断
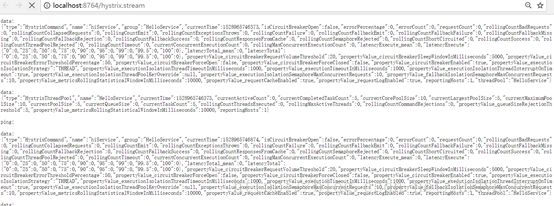
5.1 查看ribbon中的hystrix.stream流:
直接在浏览器中输入localhost:8764/hystrix.stream可以看到ping信息
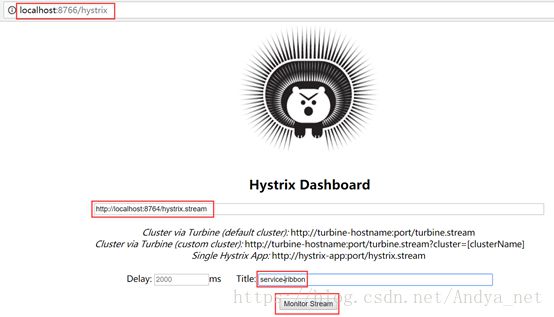
5.2 在仪表盘里输入ribbon的hystrix.stream
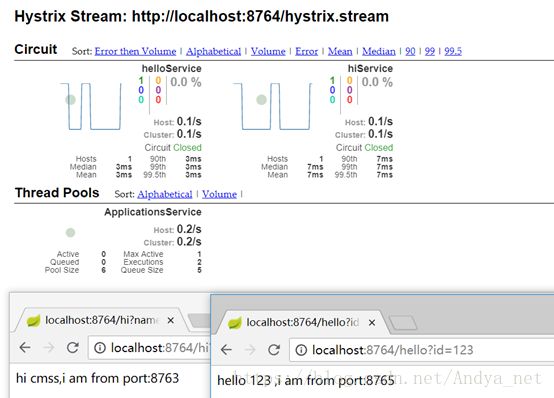
若SERVICE-HI和SERVICE-HELLO都在启动状态(分别通过RIBBON去访问者两个应用服务),请求一次后得到如下视图:
5.3 断开SERVICE-HELLO的应用
(1)在eureka中只有SERVICE-HI应用和SERVICE-RIBBON,无SERVICE-HELLO;
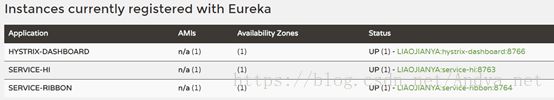
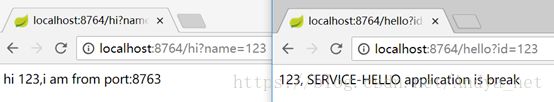
(2)通过SERVICE-RIBBON分别触发SERVICE-HI和SERVICE-HELLO应用,发现SERVICE-HELLO已熔断;
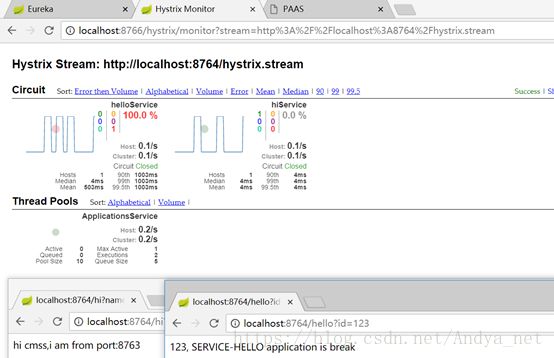
(3)查看dashboard仪表盘可以看到如下监控
6、 对单个服务进行熔断
6.1 对SERVICE-HELLO这个服务添加熔断机制
(1)添加依赖
(2)启动类上开启熔断,添加@EnableHystrix注解
(3)在需要熔断的方法上添加@HystrixCommand注解进行熔断降级

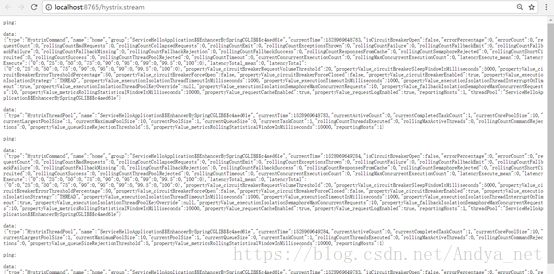
6.2 查看ribbon中的hystrix.stream
在浏览器中输入http://localhost:8765/hystrix.stream
6.3 在hystrix-dashboard中查看
输入http://localhost:8765/hystrix.stream,并去触发HELLO-SERVICE应用。
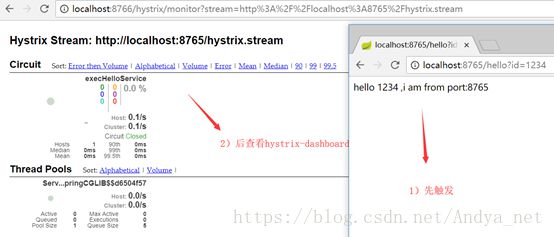
点击15次后显示触发成功次数15次,Pool Size默认为10;

7、 仪表盘详解
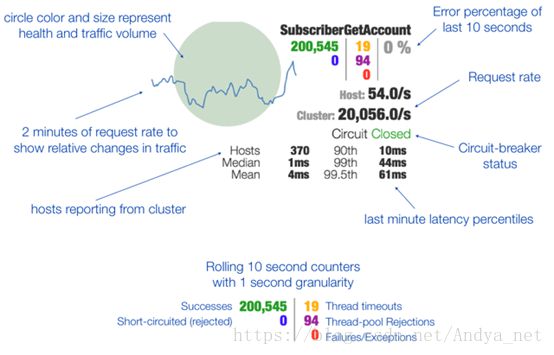
7.1 仪表盘界面详解

7.2 断路信息详解

以下是引用图片
7.3 判断断路器的打开/关闭状态isOpen()
如果断路器打开标识为true,则直接返回true,表示断路器处于打开状态,否则,就从度量指标对象metrics中获取HealthCounts统计对象做进一步判断(该对象记录了一个滚动时间窗内的请求信息快照,默认时间窗为10秒)
1)如果它的请求总数(QPS)在预设的阈值范围内就返回false,表示断路器处于未打开状态,该阈值的配置参数为circuitBreakerRequestVolumeThreshold,默认值为20.
2)如果错误百分比在阈值范围内就返回false,表示断路器处于未打开状态,该阈值的配置参数为circuitBreakerErrorThresholdPercentage,默认值为50.
如果上面的两个条件都不满足,则将断路器设置为打开状态(熔断/短路)。同时,如果是从关闭状态切换到打开状态的话,就将当前时间记录到circuitOpenedOrLastTestedTime对象中。
代码:https://github.com/Anyda123