爬虫+pyecharts数据分析实例:当当网
转载自公众号:Charles_pikachu
任务:
根据给定的关键字,爬取与该关键字相关的所有图书数据。
实现:
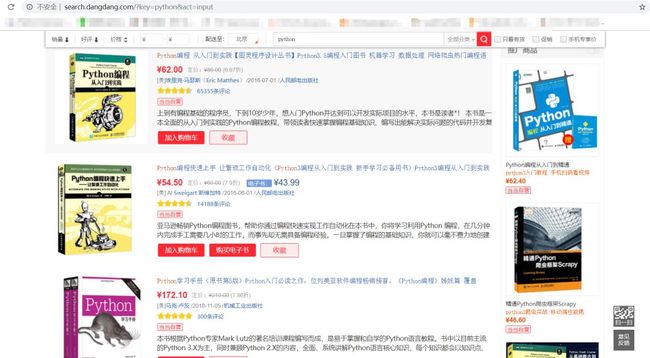
以关键字为python为例,我们要爬取的图书数据的网页页面是这样子的:
其中,网页的链接格式为:
http://search.dangdang.com/?key={keyword}&act=input&page_index={page_index}'
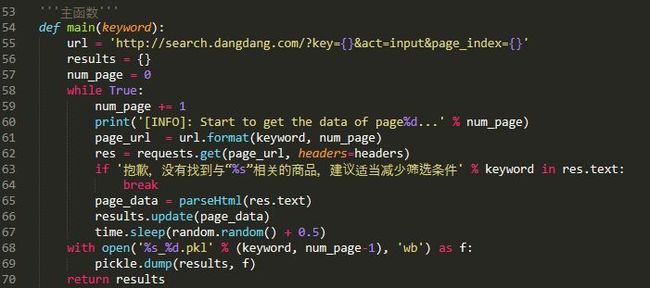
因此请求所有与关键词相关的链接:
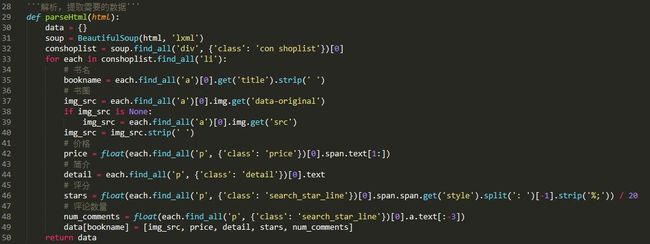
然后利用BeautifulSoup分别解析返回的网页数据,提取我们自己需要的数据即可:
运行效果:
在cmd窗口运行"ddSpider.py"文件即可。
效果如下:
本部分内容所有源代码均在:****相关文件里的ddSpider.py文件中。
数据分析
好的,现在就简单地可视化分析一波我们爬取到的61页python相关的图书数据吧~
让我们先看看图书的价格分布吧:
有没有人想知道最贵的一本python相关的书的单价是多少呀?答案是:28390RMB
书名是:
Python in Computers Programming
QAQ买不起买不起。
再来看看图书的评分分布呗:
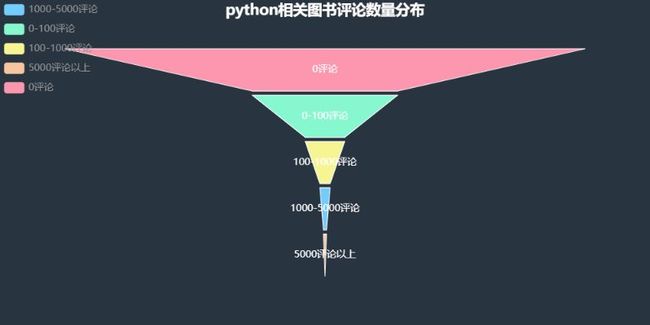
看来大多数python相关的图书都没人买过诶~大概是买不起吧T_T。
再来评论数量?
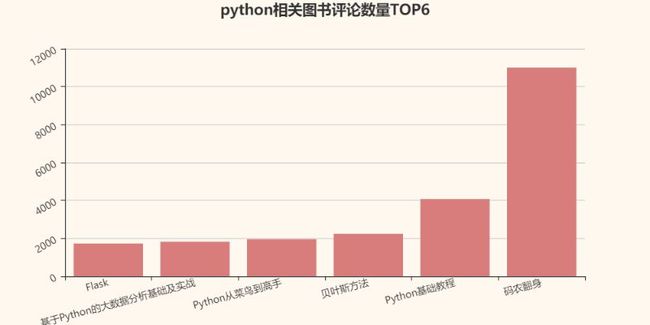
那么评论数量TOP6的图书有哪些呢?
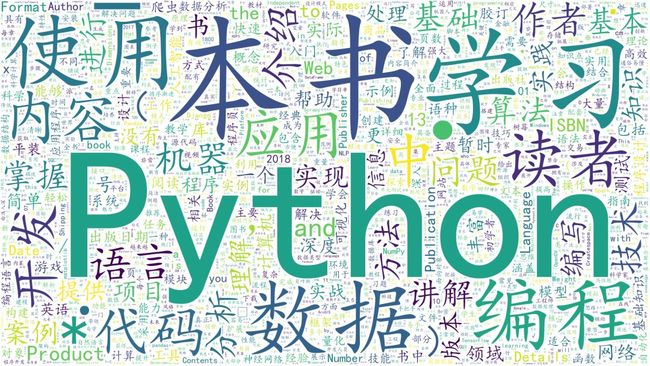
老规矩,画两个词云作结吧,把所有python相关的图书的简介做成词云如何?
本部分内容所有源代码均在:
相关文件里的analysis.py文件中。
全部代码如下:
爬虫代码:
'''
Function:
    当当网图书爬虫
Author:
    Charles
微信公众号:
    Charles的皮卡丘
'''
import time
import pickle
import random
import requests
from bs4 import BeautifulSoup


headers = {
    'Upgrade-Insecure-Requests': '1',
    'User-Agent': 'Mozilla/5.0 (Windows NT 10.0; Win64; x64) AppleWebKit/537.36 (KHTML, like Gecko) Chrome/72.0.3626.119 Safari/537.36',
    'Accept-Encoding': 'gzip, deflate',
    'Accept-Language': 'zh-CN,zh;q=0.9,en;q=0.8',
    'Cache-Control': 'no-cache',
    'Connection': 'keep-alive',
    'Host': 'search.dangdang.com'
}


'''解析, 提取需要的数据'''
def parseHtml(html):
    data = {}
    soup = BeautifulSoup(html, 'lxml')
    conshoplist = soup.find_all('div', {'class': 'con shoplist'})[0]
    for each in conshoplist.find_all('li'):
        # 书名
        bookname = each.find_all('a')[0].get('title').strip(' ')
        # 书图
        img_src = each.find_all('a')[0].img.get('data-original')
        if img_src is None:
            img_src = each.find_all('a')[0].img.get('src')
        img_src = img_src.strip(' ')
        # 价格
        price = float(each.find_all('p', {'class': 'price'})[0].span.text[1:])
        # 简介
        detail = each.find_all('p', {'class': 'detail'})[0].text
        # 评分
        stars = float(each.find_all('p', {'class': 'search_star_line'})[0].span.span.get('style').split(': ')[-1].strip('%;')) / 20
        # 评论数量
        num_comments = float(each.find_all('p', {'class': 'search_star_line'})[0].a.text[:-3])
        data[bookname] = [img_src, price, detail, stars, num_comments]
    return data


'''主函数'''
def main(keyword):
    url = 'http://search.dangdang.com/?key={}&act=input&page_index={}'
    results = {}
    num_page = 0
    while True:
        num_page += 1
        print('[INFO]: Start to get the data of page%d...' % num_page)
        page_url  = url.format(keyword, num_page)
        res = requests.get(page_url, headers=headers)
        if '抱歉,没有找到与“%s”相关的商品,建议适当减少筛选条件' % keyword in res.text:
            break
        page_data = parseHtml(res.text)
        results.update(page_data)
        time.sleep(random.random() + 0.5)
    with open('%s_%d.pkl' % (keyword, num_page-1), 'wb') as f:
        pickle.dump(results, f)
    return results


if __name__ == '__main__':
    main('python')
分析代码:
'''
Function:
    当当网图书爬虫
Author:
    Charles
微信公众号:
    Charles的皮卡丘
'''
import os
import jieba
import pickle
from pyecharts import Bar
from pyecharts import Pie
from pyecharts import Funnel
from wordcloud import WordCloud


'''柱状图(2维)'''
def drawBar(title, data, savepath='./results'):
    if not os.path.exists(savepath):
        os.mkdir(savepath)
    bar = Bar(title, title_pos='center')
    bar.use_theme('vintage')
    attrs = [i for i, j in data.items()]
    values = [j for i, j in data.items()]
    bar.add('', attrs, values, xaxis_rotate=15, yaxis_rotate=30)
    bar.render(os.path.join(savepath, '%s.html' % title))


'''饼图'''
def drawPie(title, data, savepath='./results'):
    if not os.path.exists(savepath):
        os.mkdir(savepath)
    pie = Pie(title, title_pos='center')
    pie.use_theme('westeros')
    attrs = [i for i, j in data.items()]
    values = [j for i, j in data.items()]
    pie.add('', attrs, values, is_label_show=True, legend_orient="vertical", legend_pos="left", radius=[30, 75], rosetype="area")
    pie.render(os.path.join(savepath, '%s.html' % title))


'''漏斗图'''
def drawFunnel(title, data, savepath='./results'):
    if not os.path.exists(savepath):
        os.mkdir(savepath)
    funnel = Funnel(title, title_pos='center')
    funnel.use_theme('chalk')
    attrs = [i for i, j in data.items()]
    values = [j for i, j in data.items()]
    funnel.add("", attrs, values, is_label_show=True, label_pos="inside", label_text_color="#fff", funnel_gap=5, legend_pos="left", legend_orient="vertical")
    funnel.render(os.path.join(savepath, '%s.html' % title))


'''统计词频'''
def statistics(texts, stopwords):
    words_dict = {}
    for text in texts:
        temp = jieba.cut(text)
        for t in temp:
            if t in stopwords or t == 'unknow':
                continue
            if t in words_dict.keys():
                words_dict[t] += 1
            else:
                words_dict[t] = 1
    return words_dict


'''词云'''
def drawWordCloud(words, title, savepath='./results'):
    if not os.path.exists(savepath):
        os.mkdir(savepath)
    wc = WordCloud(font_path='simkai.ttf', background_color='white', max_words=2000, width=1920, height=1080, margin=5)
    wc.generate_from_frequencies(words)
    wc.to_file(os.path.join(savepath, title+'.png'))


if __name__ == '__main__':
    with open('python_61.pkl', 'rb') as f:
        data = pickle.load(f)
    # 价格分布
    results = {}
    prices = []
    price_max = ['', 0]
    for key, value in data.items():
        price = value[1]
        if price_max[1] < price:
            price_max = [key, price]
        prices.append(price)
    results['小于50元'] = sum(i < 50 for i in prices)
    results['50-100元'] = sum((i < 100 and i >= 50) for i in prices)
    results['100-200元'] = sum((i < 200 and i >= 100) for i in prices)
    results['200-300元'] = sum((i < 300 and i >= 200) for i in prices)
    results['300-400元'] = sum((i < 400 and i >= 300) for i in prices)
    results['400元以上'] = sum(i >= 400 for i in prices)
    drawPie('python相关图书的价格分布', results)
    print('价格最高的图书为: %s, 目前单价为: %f' % (price_max[0], price_max[1]))
    # 评分分布
    results = {}
    stars = []
    for key, value in data.items():
        star = value[3] if value[3] > 0 else '暂无评分'
        stars.append(str(star))
    for each in sorted(set(stars)):
        results[each] = stars.count(each)
    drawBar('python相关图书评分分布', results)
    # 评论数量
    results = {}
    comments_num = []
    top6 = {}
    for key, value in data.items():
        num = int(value[-1])
        comments_num.append(num)
        top6[key.split('【')[0].split('(')[0].split('(')[0].split(' ')[0].split(':')[0]] = num
    results['0评论'] = sum(i == 0 for i in comments_num)
    results['0-100评论'] = sum((i > 0 and i <= 100) for i in comments_num)
    results['100-1000评论'] = sum((i > 100 and i <= 1000) for i in comments_num)
    results['1000-5000评论'] = sum((i > 1000 and i <= 5000) for i in comments_num)
    results['5000评论以上'] = sum(i > 5000 for i in comments_num)
    drawFunnel('python相关图书评论数量分布', results)
    top6 = dict(sorted(top6.items(), key=lambda item: item[1])[-6:])
    drawBar('python相关图书评论数量TOP6', top6)
    # 词云
    stopwords = open('./stopwords.txt', 'r', encoding='utf-8').read().split('\n')[:-1]
    texts = [j[2] for i, j in data.items()]
    words_dict = statistics(texts, stopwords)
    drawWordCloud(words_dict, 'python相关图书简介词云', savepath='./results')
