

1.加载包、产生数据并绘制
import numpy as np
import matplotlib.pyplot as plt
from sklearn.linear_model import LinearRegression
%matplotlib inline
np.random.seed(66)
X = np.linspace(0,50,50)
# 在执行y = 2*x + 5的基础上加上噪声
y = 2*X+5+np.random.rand(50)*10
# 转换为2维数组
X.shape = (50,1)
y.shape = (50,1)
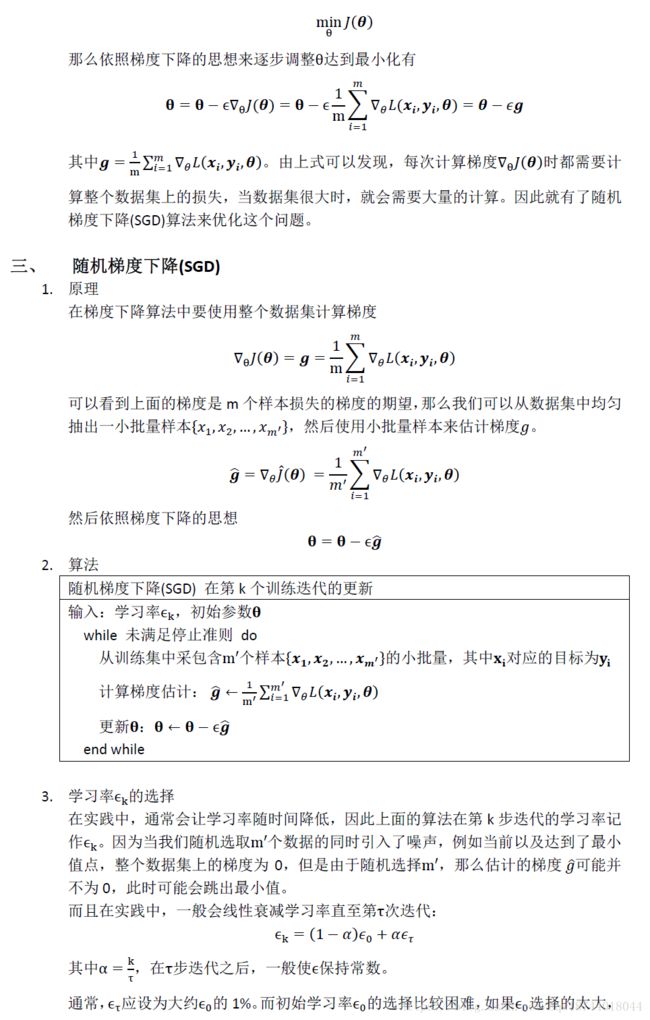
# 绘制原始数据的散点图
plt.figure(figsize=(6,6))
plt.scatter(X,y)

2.使用sklearn中的线性模型
# 训练模型
lr = LinearRegression()
lr.fit(X,y)
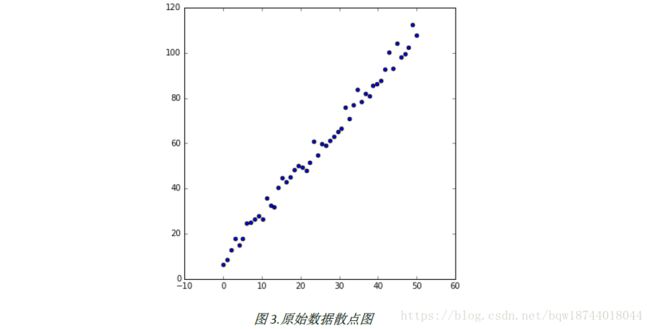
# 绘制数据散点图和拟合直线
plt.figure(figsize=(5,5))
plt.scatter(X,y)
plt.plot(X,lr.predict(X),color='red',linewidth = 3)

3.梯度下降
# 终止条件
loop_max = 10000 # 最大循环次数
epsilon = 25 # 误差阈值
# 参数
theta = np.random.rand(2,1) # 线性模型的系数,初始化为小随机数
learning_rate = 0.001 # 学习率
# 增加全1列
X = np.hstack([np.ones((50,1)),X])

for i in range(loop_max):
    # 计算梯度
    grad = np.dot(X.T,(np.dot(X,theta)-y))/X.shape[0]
    # 更新theta
    theta = theta - learning_rate*grad
    # 计算更新后的误差
    error = np.linalg.norm(np.dot(X,theta)-y)
    # 输出当前的更新次数和误差
    # print("The number of update is %d. The current error is %f"%(i,error))
    # 误差小于阈值时退出循环
    if error < epsilon:
        break

# 绘制拟合的曲线
plt.figure(figsize=(5,5))
plt.scatter(X[:,1],y)
plt.plot(X[:,1],np.dot(X,theta),color='red',linewidth = 3)

4.随机梯度下降(SGD)
# 还原参数theta,其他参数复用梯度下降
theta = np.random.rand(2,1)
# 指定每次更新使用的数据量
batch_size = 10
for i in range(loop_max):
    # 随机样本的列索引
    idxs = np.random.randint(0,X.shape[0],size=batch_size)
    # 随机样本
    tmp_X = X.take(idxs,axis=0)
    tmp_y = y.take(idxs,axis=0)
    # 计算梯度
    grad = np.dot(tmp_X.T,(np.dot(tmp_X,theta)-tmp_y))/tmp_X.shape[0]
    # 更新theta
    theta = theta - learning_rate*grad
    # 计算更新后的误差
    error = np.linalg.norm(np.dot(X,theta)-y)
    # 输出当前的更新次数和误差
    # print("The number of update is %d. The current error is %f"%(i,error))
    # 误差小于阈值时退出循环
    if error < epsilon:
        break

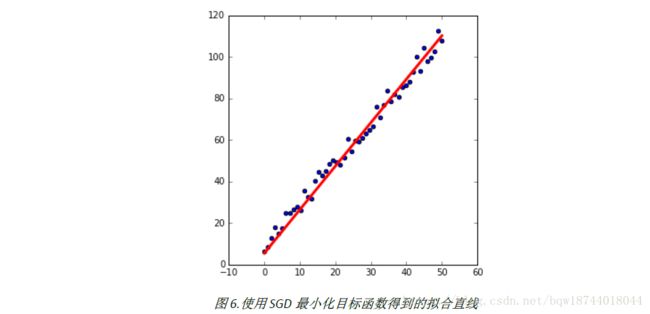
# 绘制拟合的曲线
plt.figure(figsize=(5,5))
plt.scatter(X[:,1],y)
plt.plot(X[:,1],np.dot(X,theta),color='red',linewidth = 3)


