【生信进阶练习1000days】day16~day22-RNA-seq data analysis with limma edgeR and Glimma
文章目录
- 学习来源
- 1. 数据准备
- 学习目标
- 1.1 安装RNAseq123包和所需的包,并下载样本数据
- 1.2 读入文件
- 1.3 构建样本的分组信息
- 1.4 基因注释
- 2. 数据预处理
- 2.1 转换count数据为CPM值
- 2.2 过滤表达量太低的基因
- 2.3 基因表达标准化
- 2.4 样本非监督聚类
- 3. 差异表达分析
- 3.1 差异表达分析
- 3.2 绘制Venn图
- 3.3 导出差异表达基因的数据
- 3.4 Examining individual DE genes from top to bottom
- 4. 差异基因结果可视化
- 4.1 log-CPM ~ logFC图
- 4.2 绘制热图
使用limma,edgeR,Glimma 进行完整的数据分析流程指南 可参见:
http://master.bioconductor.org/packages/release/workflows/html/RNAseq123.html
学习来源
- https://bioconductor.github.io/BiocWorkshops/rna-seq-analysis-is-easy-as-1-2-3-with-limma-glimma-and-edger.html
1. 数据准备
学习目标
- read in count data and format as a DGEList-object 读取count格式的数据,并格式化为DGE对象
- annotate Entrez gene identifiers with gene information 注释基因
- filter out lowly expressed genes 过滤低表达的基因
- normalise gene expression values 标准化基因表达数据
- unsupervised clustering of samples (standard and interactive plots) 对样本进行无监督聚类
- linear modelling for comparisons of interest 对感兴趣的分组用线性模型进行比较
- remove heteroscedascity
- examine the number of differentially expressed genes 检查差异表达基因的数目
- mean-difference plots (standard and interactive plots) 画图
- heatmaps 绘制热图
1.1 安装RNAseq123包和所需的包,并下载样本数据
suppressPackageStartupMessages({
  library(limma)
  library(Glimma)
  library(edgeR)
  library(Mus.musculus)
})
BiocManager::install("RNAseq123")
## download sample data
url <- "https://www.ncbi.nlm.nih.gov/geo/download/?acc=GSE63310&format=file"
utils::download.file(url, destfile="GSE63310_RAW.tar", mode="wb")
utils::untar("GSE63310_RAW.tar", exdir = ".")
files <- c("GSM1545535_10_6_5_11.txt", "GSM1545536_9_6_5_11.txt", "GSM1545538_purep53.txt",
           "GSM1545539_JMS8-2.txt", "GSM1545540_JMS8-3.txt", "GSM1545541_JMS8-4.txt",
           "GSM1545542_JMS8-5.txt", "GSM1545544_JMS9-P7c.txt", "GSM1545545_JMS9-P8c.txt")
for(i in paste(files, ".gz", sep=""))
  R.utils::gunzip(i, overwrite=TRUE)
1.2 读入文件
每份文件,都包含给定样本的count数;我们本次练习只包含 basal, LP 和 ML这三类样本
## read data
read.delim(file.path(".", files[1]), nrow=5)

## Use readDEG read counts
x <- readDGE(file.path(".", files), columns=c(1,3))
class(x)
dim(x)
如果count的数据是存储在单个文件中,那么可以使用 DEGList 函数,将数据读入函数后转为 DGEList 对象
1.3 构建样本的分组信息
对于下游分析而言,每个样本的分组实验信息需要添加上去。
包括: 细胞类型(本次练习中是 basal,LP,ML),基因型(wild-type野生型,knock-out 敲除型),表型(disease,status,sex,age),样本处理情况(drug,control),实验的批次信息等等
我们的DGEList对象包括:一个存储了所有细胞类型(group)和批次(lane)的 samples 的数据框。 注意,通过使用 x$sanples 提取数据时,每个样本的文库的大小会自动计算,并且 标准化因子会设置为1 。
- 为了简化后续的运算,我们首先将GEO 样本ID中的
GSM前缀去除
## Organising sample information 设定sample的名字
# 提取sample的名字
samplenames <- substring(colnames(x), 12, nchar(colnames(x)))
samplenames

## 设置样本信息
colnames(x) <- samplenames
# 分组
group <- as.factor(c("LP", "ML", "Basal", "Basal", "ML", "LP",
                     "Basal", "ML", "LP"))
x$samples$group <- group # 为每个样本添加细胞类型信息
lane <- as.factor(rep(c("L004","L006","L008"), c(3,4,2)))
x$samples$lane <- lane # 添加lane的信息
x$samples  # 此时sample信息中就会多出分组和细胞类型两列
1.4 基因注释
DGEList 对象中包含名为 genes 的二级数据框,它主要用来存储和count矩阵相对应的行的基因相关信息。基因的信息可以使用物种包(例如小鼠的 Mus.musculus 包,人类的 Homo.sapiens 包) ,或者 biomaRt 包 来完成填充注释。
- 本例中,我们使用提取物种包
Mus.musculus中的注释基因 gene symbols 和染色体信息 来为count矩阵做注释(我们count矩阵原来是按照entrez id 来对基因进行表示的,这次我们通过与entrez id 对应的 gene symbol和染色体信息,来完善矩阵的基因注释)
## using the Mus.musculus package
## to retrieve associated gene symbols and chromosome information
geneid <- rownames(x)
genes <- select(Mus.musculus, keys=geneid, columns=c("SYMBOL", "TXCHROM"),
                keytype="ENTREZID")   # 提取symbol和chr, 以entrezid作为map id的源头
head(genes)
## !duplicated replicate genes
genes <- genes[!duplicated(genes$ENTREZID),]
## add genes 将提取好的基因信息添加入我们的DGEList中genes这个二级数据框
x$genes <- genes
x
需要注意的是
在本例中,注释和数据对象中的基因顺序是相同的。如果由于缺失和/或重新排列的基因id而不是这种情况,则可以使用 match 函数对基因进行正确排序。然后,将基因注释的数据框架添加到数据对象中,并整齐地打包在DGEList对象中,DGEList对象包含原始计数数据以及相关的样本信息和基因注释。
- 这个时候就可以看到我们的DGEList对象x中有
三个二级数据框了:samples,counts,genes
> x
An object of class "DGEList"
$samples
                                 files group lib.size norm.factors lane
5_10_6_5_11 ./GSM1545535_10_6_5_11.txt    LP 32863052            1 L004
6_9_6_5_11   ./GSM1545536_9_6_5_11.txt    ML 35335491            1 L004
8_purep53     ./GSM1545538_purep53.txt Basal 57160817            1 L004
9_JMS8-2       ./GSM1545539_JMS8-2.txt Basal 51368625            1 L006
0_JMS8-3       ./GSM1545540_JMS8-3.txt    ML 75795034            1 L006
1_JMS8-4       ./GSM1545541_JMS8-4.txt    LP 60517657            1 L006
2_JMS8-5       ./GSM1545542_JMS8-5.txt Basal 55086324            1 L006
4_JMS9-P7c   ./GSM1545544_JMS9-P7c.txt    ML 21311068            1 L008
5_JMS9-P8c   ./GSM1545545_JMS9-P8c.txt    LP 19958838            1 L008

$counts
           Samples
Tags        5_10_6_5_11 6_9_6_5_11 8_purep53 9_JMS8-2 0_JMS8-3 1_JMS8-4 2_JMS8-5 4_JMS9-P7c
  497097              1          2       342      526        3        3      535          2
  100503874           0          0         5        6        0        0        5          0
  100038431           0          0         0        0        0        0        1          0
  19888               0          1         0        0       17        2        0          1
  20671               1          1        76       40       33       14       98         18
           Samples
Tags        5_JMS9-P8c
  497097             0
  100503874          0
  100038431          0
  19888              0
  20671              8
27174 more rows ...

$genes
   ENTREZID  SYMBOL TXCHROM
1    497097    Xkr4    chr1
2 100503874 Gm19938
3 100038431 Gm10568
4     19888     Rp1    chr1
5     20671   Sox17    chr1
27174 more rows ...
2. 数据预处理
2.1 转换count数据为CPM值
差异表达分析之前,由于不同的测序深度会导致counts数目不同,所以为了消除这种由建库引起的基因之间的差异,我们需要将数据归一化。归一化常见的方法有: CPM, log-CPM, RPKM 和 FPKM 。本例中使用CPM值(这已足够)。
- 本例中使用
edgeR包中的cpm函数来完成数据的归一化,log转换的时候取0.25作为先验来避免取到0 . (edgeR 包也提供了rpkm函数 来计算 RPKM值)
## convert counts to CPM and log-CPM
cpm <- cpm(x)
lcpm <- cpm(x, log=TRUE) # 取log值
2.2 过滤表达量太低的基因
## Removing genes that are lowly expressed
# 首先查看那些在所有样本中均为0的基因数目
table(rowSums(x$counts==0)==9) # 可以发现有5153个基因在所有样本中表达量均为0
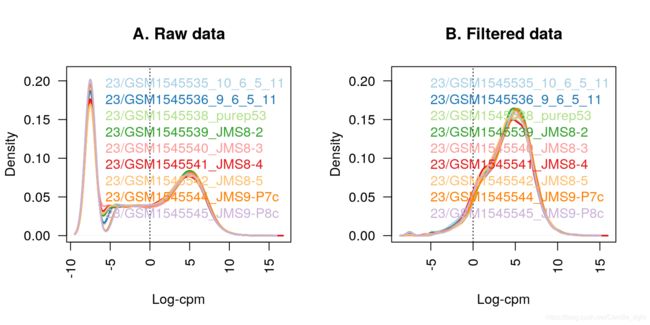
- 在任何情况下,生物学水平上没有表达的基因都应该被丢弃,这样可以将基因的子集缩小到那些感兴趣的基因,并在做差异表达时减少下游分析所用于检验的基因数量。通过检验log-CPM值可以看出,每个样本中都有很大比例的基因未表达或低表达(如图a所示)。
- 以CPM为1(相当于log-CPM值为0)作为分界线阈值来检查基因是低表达或者高表达,如果其表达高于此阈值,则视为表达,否则为低表达。基因必须在至少一组中表达(或在整个实验中至少三个样本中表达),以备后续分析。
- 在这里,CPM值为1意味着如果一个基因在测序深度最低的样本中至少有20个计数(JMS9-P8c,文库大小约为2600万)。在测序深度最大的样本中至少有76个计数(JMS8-3,库大小约为。7600万)。如果测得的reads是外显子的而不是整个基因的,或实验的测序深度较低,则可以考虑较低的CPM阈值。
# 取出至少在三个样本中cpm值均大于1的基因
keep.exprs <- rowSums(cpm>1)>=3
x <- x[keep.exprs,, keep.lib.sizes=FALSE]
dim(x)
通过以上代码的过滤操作,我们就把基因的数量减少到最开始输入的一半了
接下来我们通过绘图,来可视化这个过程
## 绘图展示基因过滤前后log-cpm值的分布情况
library(RColorBrewer)
nsamples <- ncol(x)
col <- brewer.pal(nsamples, "Paired") ## 配置绘图调色盘的主题,paired 是 qualitative palettes 中的一个颜色配置
# col <- brewer.pal(nsamples, "Pastel1") # 尝试使用其它颜色
par(mfrow=c(1,2))
plot(density(lcpm[,1]), col=col[1], lwd=2, ylim=c(0,0.21), las=2,
     main="", xlab="") # 首先对第一列的第一个样本绘图
title(main="A. Raw data", xlab="Log-cpm") # 加入title
abline(v=0, lty=3) # 在0坐标处添加分隔虚线
for (i in 2:nsamples){ # 批量在同一画布上绘出其它样本的cpm分布情况
  den <- density(lcpm[,i])
  lines(den$x, den$y, col=col[i], lwd=2)
}
legend("topright", samplenames, text.col=col, bty="n") # 添加图例
## 开始对过滤后的lcpm绘图,函数功能注释基本同上
lcpm <- cpm(x, log=TRUE)
plot(density(lcpm[,1]), col=col[1], lwd=2, ylim=c(0,0.21), las=2,
     main="", xlab="")
title(main="B. Filtered data", xlab="Log-cpm")
abline(v=0, lty=3)
for (i in 2:nsamples){
  den <- density(lcpm[,i])
  lines(den$x, den$y, col=col[i], lwd=2)
}
legend("topright", samplenames, text.col=col, bty="n")
2.3 基因表达标准化
- 使用
edgeR包中的calcNormFactors函数来进行数据标准化 ,
这里计算的标准化因子用作库大小的比例因子。 - 当用此函数对
DGEList对象做标准化时,标准化后的尺度因子会自动存储在x$samples$norm.factors中。 - 对于本例数据集而言,TMM标准化的过程比较温和,可以发现标准化的尺度因子基本都接近于1
x <- calcNormFactors(x, method = "TMM")
x$samples$norm.factors
[1] 0.9053456 1.0211400 1.0406751 1.0414376 0.9933397 0.9145960 0.9962872
[8] 1.1050585 0.9978264
- 接下来可视化展示数据标准化后的情况
为了使可视化更加的直观,我们对数据进行略微的调整:使第一个样本的计数减少到原始值的5%,而在第二个样本中,它们被扩大到原来的5倍
x2 <- x # 制作一份copy x2
x2$samples$norm.factors <- 1
x2$counts[,1] <- ceiling(x2$counts[,1]*0.05)
x2$counts[,2] <- x2$counts[,2]*5
- 绘制箱线图
par(mfrow=c(1,2))
lcpm <- cpm(x2, log=TRUE)
boxplot(lcpm, las=2, col=col, main="")
title(main="A. Example: Unnormalised data",ylab="Log-cpm")
x2 <- calcNormFactors(x2)
x2$samples$norm.factors
#> [1] 0.05472223 6.13059440 1.22927355 1.17051887 1.21487709 1.05622968
#> [7] 1.14587663 1.26129350 1.11702264
lcpm <- cpm(x2, log=TRUE)
boxplot(lcpm, las=2, col=col, main="")
title(main="B. Example: Normalised data",ylab="Log-cpm")
2.4 样本非监督聚类
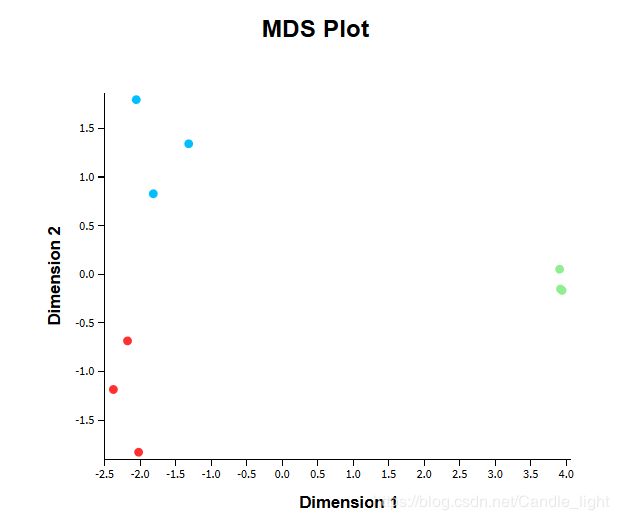
差异分析之前,一个重要的工作,就是对样本进行聚类画图分析。聚类可以揭示样本之间的相似性与差异性,这样也更好的帮助我们去判断哪些样本可以用来进行差异比较。如果是同一个处理中的多个重复样本,那么这些样本聚类的时候就会聚在一起,否则很可能是实验中数据有问题。
- limma包中提供了
plotMDS函数来实现多维标度图的绘制。
## 非监督聚类
# 展示样本之间的差异性与相似性
# 同一个处理的多个重复,没啥实验误差的话一般会聚在一起
lcpm <- cpm(x, log=TRUE)
par(mfrow=c(1,2)) # set huabu
col.group <- group
levels(col.group) <- brewer.pal(nlevels(col.group), "Set1")
col.group <- as.character(col.group)
col.lane <- lane
levels(col.lane) <- brewer.pal(nlevels(col.lane), "Set2")
col.lane <- as.character(col.lane)
plotMDS(lcpm, labels=group, col=col.group)
title(main="A. Sample groups")
plotMDS(lcpm, labels=lane, col=col.lane, dim=c(3,4))
title(main="B. Sequencing lanes")
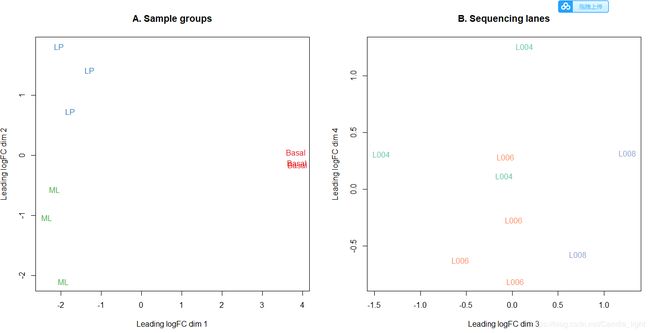 可以看到,LP,ML,Basal 三种细胞类型的样本,重复处理之间都聚在了一起。也可以发现,如果对LP 和 ML 做比对的话,可能差异比较小
- 也可以使用
Glimma包中glMDSPlot绘制MDS(multi-dimensional scaling)图 (Glimma的图是有动态效果的,很炫酷)
# Glimma 提供的绘MDS图函数
glMDSPlot(lcpm, labels=paste(group, lane, sep="_"),
          groups=x$samples[,c(2,5)], launch=FALSE)
3. 差异表达分析
- 首先设置好分组矩阵
# First,建立分组信息
design <- model.matrix(~0+group+lane) # 设置分组矩阵
colnames(design) <- gsub("group", "", colnames(design)) # 去掉列名中的group
design
- 添加比对信息
# Second,use makeContrasts function 建立比较信息
contr.matrix <- makeContrasts(
  BasalvsLP = Basal-LP, # Basal 和 LP 比较
  BasalvsML = Basal - ML, # Basal 和 ML 比较
  LPvsML = LP - ML, # LP 和 ML 比较
  levels = colnames(design))
contr.matrix
3.1 差异表达分析
绘制 log-CPM均值与方差关系的图像,具有高生物学变异的实验通常导致更平坦的趋势,其中方差值在高表达值处稳定。具有低生物变异的实验倾向于导致急剧下降的趋势
- 使用voom函数 将count reads 转换为log-CPM值,并估计它的均值差异关系,从而为之后线性建模做准备
Transform count data to log2-counts per million (logCPM), estimate the mean-variance relationship and use this to compute appropriate observation-level weights. The data are then ready for linear modelling.
par(mfrow=c(1,2))
v <- voom(x, design, plot=TRUE) # Transform RNA-Seq Data Ready for Linear Modelling
v
拟合线性模型&差异表达分析
vfit <- lmFit(v, design) # Fit linear model for each gene given a series of arrays
vfit <- contrasts.fit(vfit, contrasts=contr.matrix)
efit <- eBayes(vfit)
plotSA(efit, main="Final model: Mean-variance trend")
- 查看基因分布结果
summary(decideTests(efit))
- 使用
treat从大量的差异基因中,选出更有意义的基因
# treat 类似于 ebayes
# When the number of DE genes is large,
# treat is often useful for giving preference to
# larger fold-changes and for prioritizing genes
# that are biologically important
tfit <- treat(vfit, lfc=1)
dt <- decideTests(tfit) # 使用decideTest 提取多重比较的差异基因结果
> head(dt)
#        Contrasts
#         BasalvsLP BasalvsML LPvsML
#  497097         1         1      0
#  27395          0         0      0
#  18777          0         0      0
#  21399          0         0      0
#  58175         -1        -1      0
#  108664         0         0      0
summary(dt)
#>        BasalvsLP BasalvsML LPvsML
#> Down        1417      1512    203
#> NotSig     11030     10895  13780
#> Up          1718      1758    182
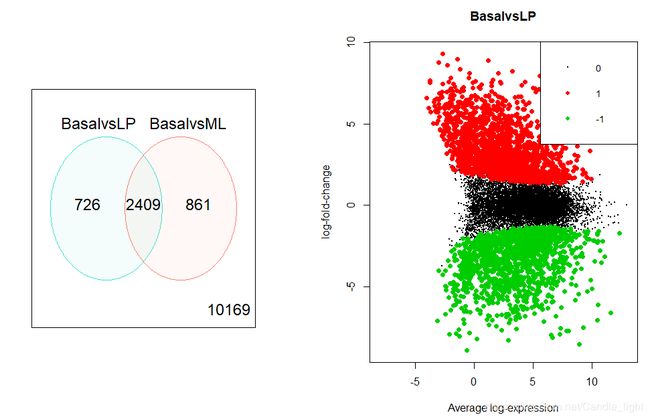
dt 中的0代表非差异基因,1代表上调基因,-1代表下调基因
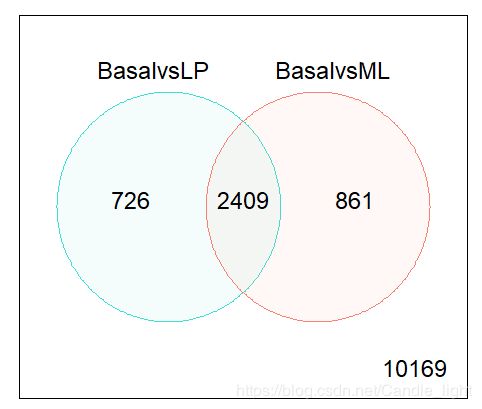
3.2 绘制Venn图
## Fourth, plot Venn
# 取出BasalvsLP和BasalvsML 这两组比较中的共同差异基因
de.common <- which(dt[,1]!=0 & dt[,2]!=0)
# 查看共同差异基因数目
length(de.common)
# 查看前20个基因symbol
head(tfit$genes$SYMBOL[de.common], n=20)
# 绘制Venn图
vennDiagram(dt[,1:2], circle.col=c("turquoise", "salmon"))
3.3 导出差异表达基因的数据
## Fifth , output result
write.fit(tfit, dt, file="results.txt")
3.4 Examining individual DE genes from top to bottom
# 使用 topTreat() 将差异基因按padj,logFC,log-CPM,t值 从小到大排序
# n=Inf 表示选取所有基因参与排序
basal.vs.lp <- topTreat(tfit, coef=1, n=Inf) # coef在此处代表选取的比对的组别
basal.vs.ml <- topTreat(tfit, coef=2, n=Inf)
head(basal.vs.lp)
head(basal.vs.ml)
4. 差异基因结果可视化
4.1 log-CPM ~ logFC图
## 差异基因结果可视化
# plot MD
plotMD(tfit, column=1, status=dt[,1], main=colnames(tfit)[1],
       xlim=c(-8,13))
# plot MD using GLimma 这个包绘制出来的是动态的MD图
glMDPlot(tfit, coef=1, status=dt, main=colnames(tfit)[1],
         side.main="ENTREZID", counts=x$counts, groups=group, launch=FALSE)
4.2 绘制热图
library(gplots)
basal.vs.lp.topgenes <- basal.vs.lp$ENTREZID[1:100]
i <- which(v$genes$ENTREZID %in% basal.vs.lp.topgenes)
mycol <- colorpanel(1000,"blue","white","red")
heatmap.2(v$E[i,], scale="row",
          labRow=v$genes$SYMBOL[i], labCol=group,
          col=mycol, trace="none", density.info="none",
          margin=c(8,6), lhei=c(2,10), dendrogram="column")
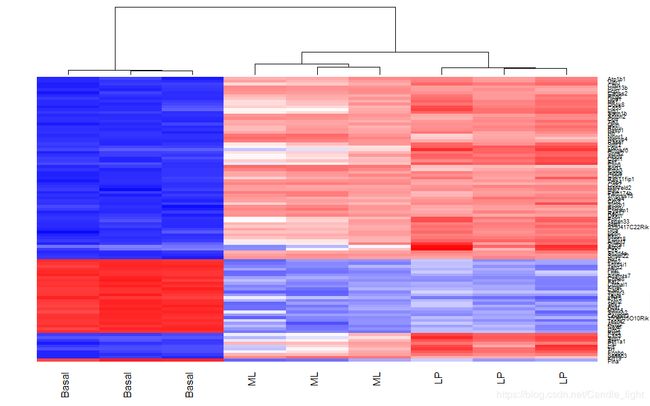
- 热图:basal与LP两个分组中前100个基因DE的log-CPM值的热图。对每个基因(或行)的表达进行了缩放,使平均值为零,标准偏差为1。给定基因表达量较高的样本用红色标记,表达量较低的样本用蓝色标记。浅色和白色代表中等表达水平的基因。采用层次聚类的方法对样本和基因进行重新排序。给出了样本聚类的树状图。
