Matplotlib简介及应用
matplotlib是Python编程语言及其数值数学扩展包 NumPy的可视化操作界面。它为利用通用的图形用户界面工具包,如Tkinter, wxPython, Qt或GTK+向应用程序嵌入式绘图提供了应用程序接口。是一个python包,用于2D绘图。
简单入门示例:
正弦函数
import matplotlib.pyplot as plt
import numpy as np
x = np.linspace(0,2*np.pi,100)
y = np.sin(x)
plt.plot(x,y)
plt.show()
主要方法:
plot,subplot,show,linspace等,还可以操作Series,Dataframe等
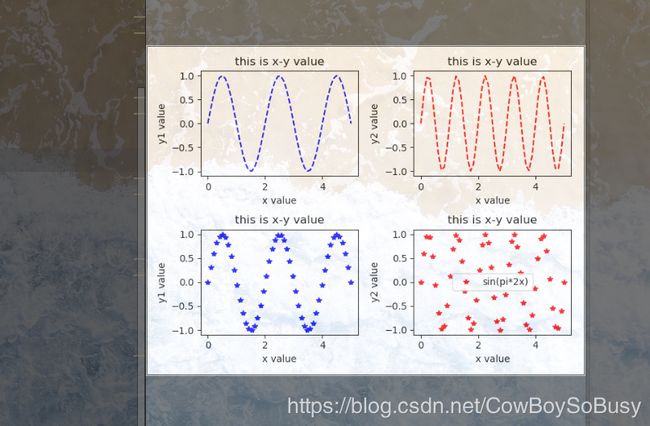
subplot生成子图:
import matplotlib.pyplot as plt
import numpy as np
x = np.linspace(0.0,5.0)
y1 = np.sin(np.pi*x)
y2 = np.sin(np.pi*x*2)
plt.subplot(2,2,1)
plt.plot(x,y1,'b--',label='sin(pi*x)')
plt.ylabel('y1 value')
plt.xlabel('x value')
plt.title('this is x-y value')
plt.subplot(2,2,2)
plt.plot(x,y2,'r--',label='sin(pi*2x)')
plt.ylabel('y2 value')
plt.xlabel('x value')
plt.title('this is x-y value')
plt.subplot(2,2,3)
plt.plot(x,y1,'b*',label='sin(pi*x)')
plt.ylabel('y1 value')
plt.xlabel('x value')
plt.title('this is x-y value')
plt.subplot(2,2,4)
plt.plot(x,y2,'r*',label='sin(pi*2x)')
plt.ylabel('y2 value')
plt.xlabel('x value')
plt.title('this is x-y value')
plt.legend()
plt.show()
Series:
import matplotlib.pyplot as plt
import numpy as np
from pandas import Series
import pandas as pd
s1 = Series(np.random.randn(1000)).cumsum()
s1.plot(kind='line',grid=True,label='S1',title='This is Series',style='--')
fig,ax = plt.subplots(2,1)
ax[0].plot(s1)
ax[1].plot(s1)
plt.legend()
plt.show()
DataFrame:
import matplotlib.pyplot as plt
import numpy as np
from pandas import Series, DataFrame
import pandas as pd

df = DataFrame(
    np.random.randint(1, 10, 40).reshape(10, 4),
    columns=['A', 'B', 'C', 'D']
)
df.plot(kind='area')
plt.show()
import matplotlib.pyplot as plt
import numpy as np
from pandas import Series, DataFrame
import pandas as pd

df = DataFrame(
    np.random.randint(1, 10, 40).reshape(10, 4),
    columns=['A', 'B', 'C', 'D']
)
df.T.plot()
plt.show()
直方图:
import matplotlib.pyplot as plt
import numpy as np
from pandas import Series, DataFrame
import pandas as pd

s = Series(np.random.randn(1000))
plt.hist(s,rwidth=0.9)
plt.show()
密度图:
import matplotlib.pyplot as plt
import numpy as np
from pandas import Series, DataFrame
import pandas as pd

s = Series(np.random.randn(1000))
s.plot(kind='kde')
plt.show()
更多图形见matplotlib官网 https://matplotlib.org/和github仓库地址https://github.com/matplotlib/matplotlib


