tSNE
t-SNE
简介
t-SNE(t-distributed stochastic neighbor embedding)是用于降维的一种机器学习算法,是由 Laurens van der Maaten 和 Geoffrey Hinton在08年提出来。此外,t-SNE 是一种非线性降维算法,非常适用于高维数据降维到2维或者3维,进行可视化。
t-SNE是由SNE(Stochastic Neighbor Embedding, SNE; Hinton and Roweis, 2002)发展而来。我们先介绍SNE的基本原理,之后再扩展到t-SNE。最后再看一下t-SNE的实现以及一些优化。
1.SNE
SNE是通过仿射(affinitie)变换将数据点映射到概率分布上,主要包括两个步骤:
- SNE构建一个高维对象之间的概率分布,使得相似的对象有更高的概率被选择,而不相似的对象有较低的概率被选择。
- SNE在低维空间里在构建这些点的概率分布,使得这两个概率分布之间尽可能的相似。
我们看到t-SNE模型是非监督的降维,他跟kmeans等不同,他不能通过训练得到一些东西之后再用于其它数据(比如kmeans可以通过训练得到k个点,再用于其它数据集,而t-SNE只能单独的对数据做操作,也就是说他只有fit_transform,而没有fit操作)
1.2 SNE原理推导
SNE是先将欧几里得距离转换为条件概率来表达点与点之间的相似度。具体来说,给定N个高维的数据 x1,...,xN, t-SNE首先是计算概率pij ,正比于xi和xj之间的相似度(这种概率是我们自主构建的),即:
这里的有一个参数是σi,对于不同的点xi取值不一样,后续会讨论如何设置。此外设置px∣x=0,因为我们关注的是两两之间的相似度。 那对于低维度下的yi,我们可以指定高斯分布为方差为![]() ,因此它们之间的相似度如下:
,因此它们之间的相似度如下:
同样,设定qi∣i=0. 如果降维的效果比较好,局部特征保留完整,那么 pi∣j=qi∣j, 因此我们优化两个分布之间的距离-KL散度(Kullback-Leibler divergences),那么目标函数(cost function)如下:
这里的Pi表示了给定点xi下,其他所有数据点的条件概率分布。需要注意的是KL散度具有不对称性,在低维映射中不同的距离对应的惩罚权重是不同的,具体来说:距离较远的两个点来表达距离较近的两个点会产生更大的cost,相反,用较近的两个点来表达较远的两个点产生的cost相对较小(注意:类似于回归容易受异常值影响,但效果相反)。即用较小的 qj∣i=0.2 来建模较大的 pj∣i=0.8, cost=plog(p/q)=1.11,同样用较大的qj∣i=0.8来建模较大的pj∣i=0.2, cost=-0.277, 因此,SNE会倾向于保留数据中的局部特征。
下面我们开始正式的推导SNE。首先不同的点具有不同的σi,Pi的熵(entropy)会随着σi的增加而增加。SNE使用困惑度(perplexity)的概念,用二分搜索的方式来寻找一个最佳的σ。其中困惑度指:
这里的H(Pi)是Pi的熵,即:
困惑度可以解释为一个点附近的有效近邻点个数。SNE对困惑度的调整比较有鲁棒性,通常选择5-50之间,给定之后,使用二分搜索的方式寻找合适的σ那么核心问题是如何求解梯度了,目标函数等价于∑∑−plog(q)这个式子与softmax非常的类似,我们知道softmax的目标函数是∑−ylogp,对应的梯度是y−p(注:这里的softmax中y表示label,p表示预估值)。 同样我们可以推导SNE的目标函数中的i在j下的条件概率情况的梯度是![]() , 同样j在i下的条件概率的梯度是
, 同样j在i下的条件概率的梯度是![]() , 最后得到完整的梯度公式如下:
, 最后得到完整的梯度公式如下:
在初始化中,可以用较小的σ下的高斯分布来进行初始化。为了加速优化过程和避免陷入局部最优解,梯度中需要使用一个相对较大的动量(momentum)。即参数更新中除了当前的梯度,还要引入之前的梯度累加的指数衰减项,如下:
这里的Y(t)表示迭代t次的解,η表示学习速率,α(t)表示迭代t次的动量。 此外,在初始优化的阶段,每次迭代中可以引入一些高斯噪声,之后像模拟退火一样逐渐减小该噪声,可以用来避免陷入局部最优解。因此,SNE在选择高斯噪声,以及学习速率,什么时候开始衰减,动量选择等等超参数上,需要跑多次优化才可以。
2.t-SNE
尽管SNE提供了很好的可视化方法,但是他很难优化,而且存在”crowding problem”(拥挤问题)。后续中,Hinton等人又提出了t-SNE的方法。与SNE不同,主要如下:
- 使用对称版的SNE,简化梯度公式
- 低维空间下,使用t分布替代高斯分布表达两点之间的相似度
t-SNE在低维空间下使用更重长尾分布的t分布来避免crowding问题和优化问题。在这里,首先介绍一下对称版的SNE,之后介绍crowding问题,之后再介绍t-SNE。
2.1 Symmetric SNE
优化pi∣j和qi∣j的KL散度的一种替换思路是,使用联合概率分布来替换条件概率分布,即P是高维空间里各个点的联合概率分布,Q是低维空间下的,目标函数为:
这里的pii,qii为0,我们将这种SNE称之为symmetric SNE(对称SNE),因为他假设了对于任意i,pij=pji,qij=qji,因此概率分布可以改写为:
这种表达方式,使得整体简洁了很多。但是会引入异常值的问题。比如xixi是异常值,那么∣∣xi−xj∣∣2会很大,对应的所有的j, pij都会很小(之前是仅在xi下很小),导致低维映射下的yi对cost影响很小。
为了解决这个问题,我们将联合概率分布定义修正为: ![]() , 这保证了
, 这保证了 , 使得每个点对于cost都会有一定的贡献。对称SNE的最大优点是梯度计算变得简单了,如下:
实验中,发现对称SNE能够产生和SNE一样好的结果,有时甚至略好一点。
2.2 Crowding问题
拥挤问题就是说各个簇聚集在一起,无法区分。比如有一种情况,高维度数据在降维到10维下,可以有很好的表达,但是降维到两维后无法得到可信映射,比如降维如10维中有11个点之间两两等距离的,在二维下就无法得到可信的映射结果(最多3个点)。 进一步的说明,假设一个以数据点xixi为中心,半径为r的m维球(三维空间就是球),其体积是按rmrm增长的,假设数据点是在m维球中均匀分布的,我们来看看其他数据点与xixi的距离随维度增大而产生的变化。
从上图可以看到,随着维度的增大,大部分数据点都聚集在m维球的表面附近,与点xixi的距离分布极不均衡。如果直接将这种距离关系保留到低维,就会出现拥挤问题。
Cook et al.(2007) 提出一种slight repulsion的方式,在基线概率分布(uniform background)中引入一个较小的混合因子ρ,这样qij就永远不会小于2ρn(n−1) (因为一共了n(n-1)个pairs),这样在高维空间中比较远的两个点之间的qij总是会比pij大一点。这种称之为UNI-SNE,效果通常比标准的SNE要好。优化UNI-SNE的方法是先让ρ为0,使用标准的SNE优化,之后用模拟退火的方法的时候,再慢慢增加ρρ. 直接优化UNI-SNE是不行的(即一开始ρ不为0),因为距离较远的两个点基本是一样的qij(等于基线分布), 即使pij很大,一些距离变化很难在qij中产生作用。也就是说优化中刚开始距离较远的两个聚类点,后续就无法再把他们拉近了。
2.3 t-SNE
对称SNE实际上在高维度下 另外一种减轻”拥挤问题”的方法:在高维空间下,在高维空间下我们使用高斯分布将距离转换为概率分布,在低维空间下,我们使用更加偏重长尾分布的方式来将距离转换为概率分布,使得高维度下中低等的距离在映射后能够有一个较大的距离。
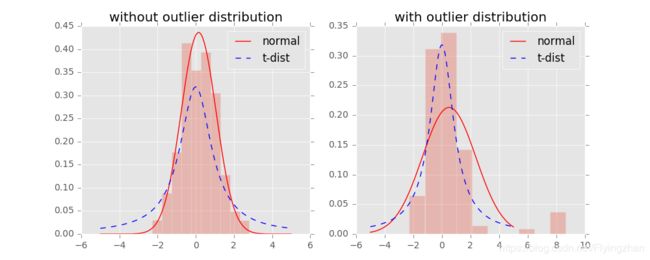
我们对比一下高斯分布和t分布(如上图,code见probability/distribution.md), t分布受异常值影响更小,拟合结果更为合理,较好的捕获了数据的整体特征。 使用了t分布之后的q变化,如下:
此外,t分布是无限多个高斯分布的叠加,计算上不是指数的,会方便很多。优化的梯度如下:
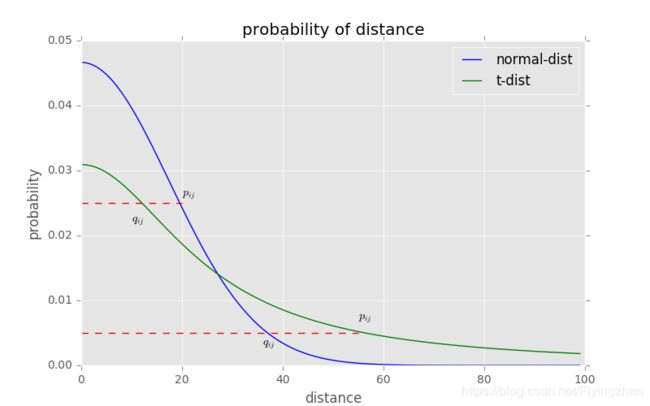
t-sne的有效性,也可以从上图中看到:横轴表示距离,纵轴表示相似度, 可以看到,对于较大相似度的点,t分布在低维空间中的距离需要稍小一点;而对于低相似度的点,t分布在低维空间中的距离需要更远。这恰好满足了我们的需求,即同一簇内的点(距离较近)聚合的更紧密,不同簇之间的点(距离较远)更加疏远。 总结一下,t-SNE的梯度更新有两大优势:
- 对于不相似的点,用一个较小的距离会产生较大的梯度来让这些点排斥开来。
- 这种排斥又不会无限大(梯度中分母),避免不相似的点距离太远。
2.4 算法过程
算法详细过程如下:
- Data: X=x1,...,xn
- 计算cost function的参数:困惑度Perp
- 优化参数: 设置迭代次数T, 学习速率η, 动量α(t)
- 目标结果是低维数据表示 YT=y1,...,yn
- 开始优化
- 结束
优化过程中可以尝试的两个trick:
- 提前压缩(early compression):开始初始化的时候,各个点要离得近一点。这样小的距离,方便各个聚类中心的移动。可以通过引入L2正则项(距离的平方和)来实现。
- 提前夸大(early exaggeration):在开始优化阶段,pij乘以一个大于1的数进行扩大,来避免因为qijqij太小导致优化太慢的问题。比如前50次迭代,pij乘以4
优化的过程动态图如下:
2.5 不足
主要不足有四个:
- 主要用于可视化,很难用于其他目的。比如测试集合降维,因为他没有显式的预估部分,不能在测试集合直接降维;比如降维到10维,因为t分布偏重长尾,1个自由度的t分布很难保存好局部特征,可能需要设置成更高的自由度。
- t-SNE倾向于保存局部特征,对于本征维数(intrinsic dimensionality)本身就很高的数据集,是不可能完整的映射到2-3维的空间
- t-SNE没有唯一最优解,且没有预估部分。如果想要做预估,可以考虑降维之后,再构建一个回归方程之类的模型去做。但是要注意,t-sne中距离本身是没有意义,都是概率分布问题。
- 训练太慢。有很多基于树的算法在t-sne上做一些改进
3.变种
后续有机会补充。
- multiple maps of t-SNE
- parametric t-SNE
- Visualizing Large-scale and High-dimensional Data
4.参考文档
- Maaten, L., & Hinton, G. (2008). Visualizing data using t-SNE. Journal of Machine Learning Research.
- 转载自http://www.datakit.cn/blog/2017/02/05/t_sne_full.html
5. 代码
文中的插图绘制:
# coding:utf-8

import numpy as np
from numpy.linalg import norm
from matplotlib import pyplot as plt
plt.style.use('ggplot')

def sne_crowding():
    npoints = 1000 # 抽取1000个m维球内均匀分布的点
    plt.figure(figsize=(20, 5))
    for i, m in enumerate((2, 3, 5, 8)):
        # 这里模拟m维球中的均匀分布用到了拒绝采样,
        # 即先生成m维立方中的均匀分布,再剔除m维球外部的点
        accepts = []
        while len(accepts) < 1000:
            points = np.random.rand(500, m)
            accepts.extend([d for d in norm(points, axis=1)
                            if d <= 1.0]) # 拒绝采样
        accepts = accepts[:npoints]
        ax = plt.subplot(1, 4, i+1)
        if i == 0:
            ax.set_ylabel('count')
        if i == 2:

            ax.set_xlabel('distance')
        ax.hist(accepts, bins=np.linspace(0., 1., 50))
        ax.set_title('m=%s' %m)
    plt.savefig("./images/sne_crowding.png")

    x = np.linspace(0, 4, 100)
    ta = 1 / (1 + np.square(x))
    tb = np.sum(ta) - 1
    qa = np.exp(-np.square(x))
    qb = np.sum(qa) - 1

def sne_norm_t_dist_cost():
    plt.figure(figsize=(8, 5))
    plt.plot(qa/qb, c="b", label="normal-dist")
    plt.plot(ta/tb, c="g", label="t-dist")
    plt.plot((0, 20), (0.025, 0.025), 'r--')
    plt.text(10, 0.022, r'$q_{ij}$')
    plt.text(20, 0.026, r'$p_{ij}$')

    plt.plot((0, 55), (0.005, 0.005), 'r--')
    plt.text(36, 0.003, r'$q_{ij}$')
    plt.text(55, 0.007, r'$p_{ij}$')

    plt.title("probability of distance")
    plt.xlabel("distance")
    plt.ylabel("probability")
    plt.legend()
    plt.savefig("./images/sne_norm_t_dist_cost.png")

if __name__ == '__main__':
    sne_crowding()
    sne_norm_t_dist_cost()
附录一下t-sne的完整代码实现:
# coding utf-8
'''
代码参考了作者Laurens van der Maaten的开放出的t-sne代码, 并没有用类进行实现,主要是优化了计算的实现
'''
import numpy as np


def cal_pairwise_dist(x):
    '''计算pairwise 距离, x是matrix
    (a-b)^2 = a^w + b^2 - 2*a*b
    '''
    sum_x = np.sum(np.square(x), 1)
    dist = np.add(np.add(-2 * np.dot(x, x.T), sum_x).T, sum_x)
    return dist


def cal_perplexity(dist, idx=0, beta=1.0):
    '''计算perplexity, D是距离向量,
    idx指dist中自己与自己距离的位置,beta是高斯分布参数
    这里的perp仅计算了熵,方便计算
    '''
    prob = np.exp(-dist * beta)
    # 设置自身prob为0
    prob[idx] = 0
    sum_prob = np.sum(prob)
    perp = np.log(sum_prob) + beta * np.sum(dist * prob) / sum_prob
    prob /= sum_prob
    return perp, prob


def seach_prob(x, tol=1e-5, perplexity=30.0):
    '''二分搜索寻找beta,并计算pairwise的prob
    '''

    # 初始化参数
    print("Computing pairwise distances...")
    (n, d) = x.shape
    dist = cal_pairwise_dist(x)
    pair_prob = np.zeros((n, n))
    beta = np.ones((n, 1))
    # 取log,方便后续计算
    base_perp = np.log(perplexity)

    for i in range(n):
        if i % 500 == 0:
            print("Computing pair_prob for point %s of %s ..." %(i,n))

        betamin = -np.inf
        betamax = np.inf
        perp, this_prob = cal_perplexity(dist[i], i, beta[i])

        # 二分搜索,寻找最佳sigma下的prob
        perp_diff = perp - base_perp
        tries = 0
        while np.abs(perp_diff) > tol and tries < 50:
            if perp_diff > 0:
                betamin = beta[i].copy()
                if betamax == np.inf or betamax == -np.inf:
                    beta[i] = beta[i] * 2
                else:
                    beta[i] = (beta[i] + betamax) / 2
            else:
                betamax = beta[i].copy()
                if betamin == np.inf or betamin == -np.inf:
                    beta[i] = beta[i] / 2
                else:
                    beta[i] = (beta[i] + betamin) / 2

            # 更新perb,prob值
            perp, this_prob = cal_perplexity(dist[i], i, beta[i])
            perp_diff = perp - base_perp
            tries = tries + 1
        # 记录prob值
        pair_prob[i,] = this_prob
    print("Mean value of sigma: ", np.mean(np.sqrt(1 / beta)))
    return pair_prob


def pca(x, no_dims = 50):
    ''' PCA算法
    使用PCA先进行预降维
    '''
    print("Preprocessing the data using PCA...")
    (n, d) = x.shape
    x = x - np.tile(np.mean(x, 0), (n, 1))
    l, M = np.linalg.eig(np.dot(x.T, x))
    y = np.dot(x, M[:,0:no_dims])
    return y


def tsne(x, no_dims=2, initial_dims=50, perplexity=30.0, max_iter=1000):
    """Runs t-SNE on the dataset in the NxD array x
    to reduce its dimensionality to no_dims dimensions.
    The syntaxis of the function is Y = tsne.tsne(x, no_dims, perplexity),
    where x is an NxD NumPy array.
    """

    # Check inputs
    if isinstance(no_dims, float):
        print("Error: array x should have type float.")
        return -1
    if round(no_dims) != no_dims:
        print("Error: number of dimensions should be an integer.")
        return -1

    # 初始化参数和变量
    x = pca(x, initial_dims).real
    (n, d) = x.shape
    initial_momentum = 0.5
    final_momentum = 0.8
    eta = 500
    min_gain = 0.01
    y = np.random.randn(n, no_dims)
    dy = np.zeros((n, no_dims))
    iy = np.zeros((n, no_dims))
    gains = np.ones((n, no_dims))

    # 对称化
    P = seach_prob(x, 1e-5, perplexity)
    P = P + np.transpose(P)
    P = P / np.sum(P)
    # early exaggeration
    P = P * 4
    P = np.maximum(P, 1e-12)

    # Run iterations
    for iter in range(max_iter):
        # Compute pairwise affinities
        sum_y = np.sum(np.square(y), 1)
        num = 1 / (1 + np.add(np.add(-2 * np.dot(y, y.T), sum_y).T, sum_y))
        num[range(n), range(n)] = 0
        Q = num / np.sum(num)
        Q = np.maximum(Q, 1e-12)

        # Compute gradient
        PQ = P - Q
        for i in range(n):
            dy[i,:] = np.sum(np.tile(PQ[:,i] * num[:,i], (no_dims, 1)).T * (y[i,:] - y), 0)

        # Perform the update
        if iter < 20:
            momentum = initial_momentum
        else:
            momentum = final_momentum
        gains = (gains + 0.2) * ((dy > 0) != (iy > 0)) + (gains * 0.8) * ((dy > 0) == (iy > 0))
        gains[gains < min_gain] = min_gain
        iy = momentum * iy - eta * (gains * dy)
        y = y + iy
        y = y - np.tile(np.mean(y, 0), (n, 1))
        # Compute current value of cost function
        if (iter + 1) % 100 == 0:
            if iter > 100:
                C = np.sum(P * np.log(P / Q))
            else:
                C = np.sum( P/4 * np.log( P/4 / Q))
            print("Iteration ", (iter + 1), ": error is ", C)
        # Stop lying about P-values
        if iter == 100:
            P = P / 4
    print("finished training!")
    return y


if __name__ == "__main__":
    # Run Y = tsne.tsne(X, no_dims, perplexity) to perform t-SNE on your dataset.
    X = np.loadtxt("mnist2500_X.txt")
    labels = np.loadtxt("mnist2500_labels.txt")
    Y = tsne(X, 2, 50, 20.0)
    from matplotlib import pyplot as plt
    plt.scatter(Y[:,0], Y[:,1], 20, labels)
    plt.show()


